


Williams’ Strategy
Bill Williams is the creator of some of the most popular market indicators: Awesome Oscillator, Fractals, Alligator, and Gator.

Don’t waste your time – keep track of how NFP affects the US dollar!
Data Collection Notice
We maintain a record of your data to run this website. By clicking the button, you agree to our Privacy Policy.

Beginner Forex Book
Your ultimate guide through the world of trading.

Check Your Inbox!
In our email, you will find the Forex 101 book. Just tap the button to get it!
Risk warning: CFDs are complex instruments and come with a high risk of losing money rapidly due to leverage.
66.43% of retail investor accounts lose money when trading CFDs with this provider.
You should consider whether you understand how CFDs work and whether you can afford to take the high risk of losing your money.
Warning! Old version of the browser!
Press one of the icons below to proceed to the official website of the developer and download the latest version of your browser.

Online Forex broker
2022-08-26 • Updated
Information is not investment advice
For a lot of traders, it may be problematic to decide on trading strategy when the market enters an indecisive zone. It may be a horizontal flattening zone such as on the H1 chart of EUR/CAD below, let’s have a look.
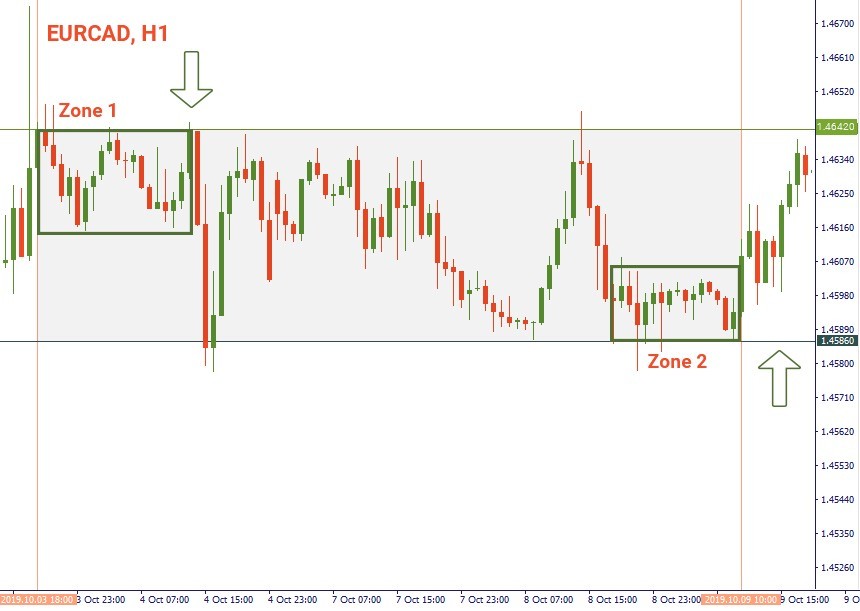
The clue to identify the coming movement of the market is putting each such zone against the corresponding level of support or resistance.
On the chart above the grey rectangle indicates a horizontal movement sector between the support level of 1.4586 and the resistance level of 1.4642.
Zone 1 contains a flattening zone right at the side of the resistance line. The zone was formed by the short-term consolidation of the market. For many traders that would be a sign of a break up and continuation of the bullish trend. However, in fact, it is the opposite: the flat congestion at the resistance line results in the sharp drop. Accordingly, those who took short position within Zone 1 would benefit from this unexpected drop.
Zone 2 contains a similar flattening but now at the support level. To some it would be interpreted as waiting moment to see the chart go further down, but again it is the opposite. Right after Zone 2 the euro started the upward movement breaking the resistance level and reaching a new local high.
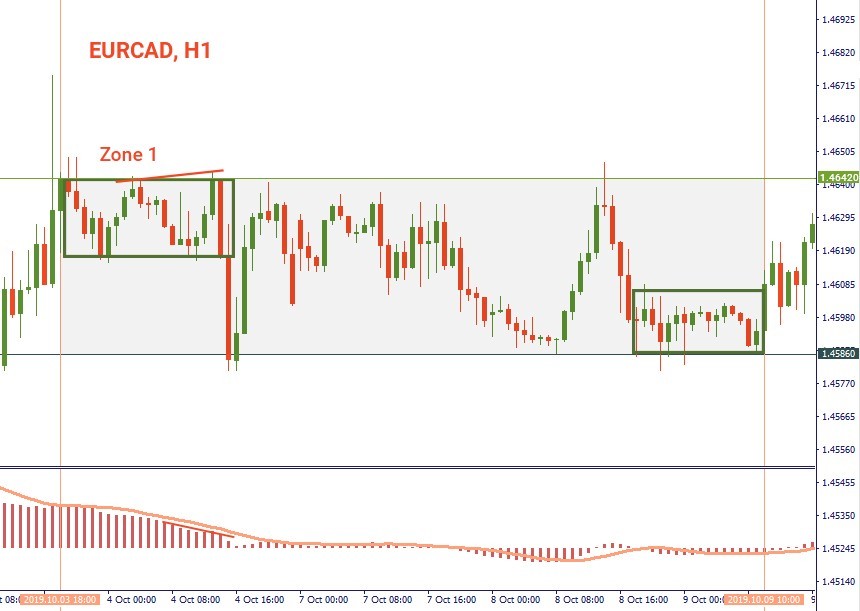
It seems quite easy to determine such zones but sometimes the real situation is not that clear. You should remember that the market can move both ways. That’s why it’s important to get additional confirmation from other indicators, chart patterns, or candlesticks. For example, if the MACD indicator or Awesome Oscillator formed bearish/bullish divergence, it’s time for a reversal. Let us have a closer look.
The image below shows Zone 1 of the same initial chart. We see here a market consolidation at the general resistance level and a slow rise in the local resistance level marked by the brown line. The MACD indicator corresponding to the same sector shows gradual drop marked by another brown line. Both lines in combination create a bearish divergence seen as a precursor of a bearish reversal of the market. Which we see right after the examined sector, so it would be advised to sell within Zone 1.
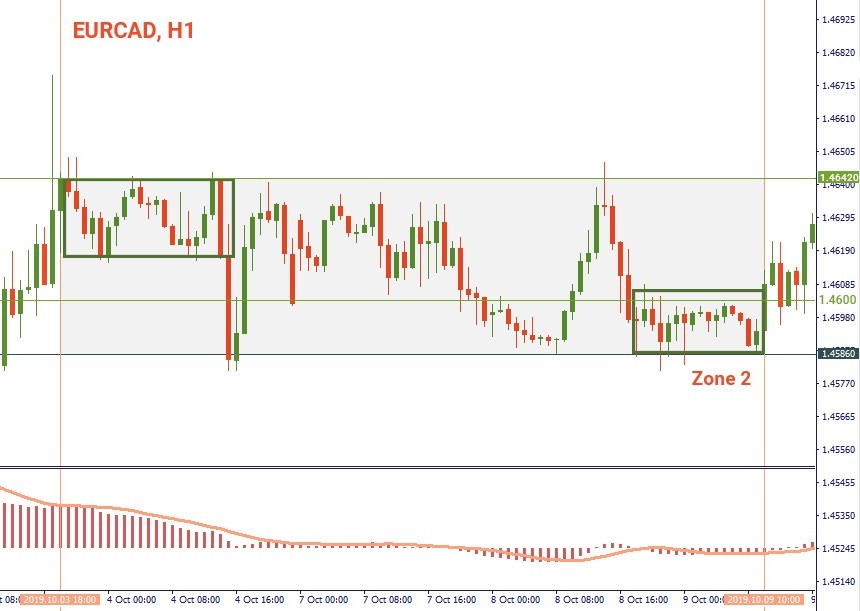
Zone 2 is examined in the next image. It shows a flattening right above the support level, as if market was taking a moment of silence to gather strength and decide where to go. The local resistance level is at 1.4601 for this specific zone. As the bullish bar at the end of the selected zone breaks this resistance level, it would mean that the market intends to revert back up and move with the bulls. Accordingly, it would be advised to open a long position within Zone 2.
Conclusion
Now we can state that a market consolidation at the level of resistance or support often may be an indicator of a bounce back from that corresponding level. Flattening at resistance level indicates a potential for bearish movement, while a flattening at support level indicates a potential for bullish movement. Therefore, we buy at the support level when flattening and we sell at the resistance level when flattening.

Bill Williams is the creator of some of the most popular market indicators: Awesome Oscillator, Fractals, Alligator, and Gator.

Trend strategies are good - they may give significantly good results in any time frame and with any assets. The main idea of the ADX Trend-Based strategy is to try to catch the beginning of the trend.

Counter-trend strategies are always the most dangerous but also the most profitable. We are pleased to present an excellent counter-trend strategy for working in any market and with any assets.


Your request is accepted.
We will call you at the time interval that you chose
Next callback request for this phone number will be available in 00:30:00
If you have an urgent issue please contact us via
Live chat
Internal error. Please try again later