Bill Williams is the creator of some of the most popular market indicators: Awesome Oscillator, Fractals, Alligator, and Gator.

Don’t waste your time – keep track of how NFP affects the US dollar!
Data Collection Notice
We maintain a record of your data to run this website. By clicking the button, you agree to our Privacy Policy.

Beginner Forex Book
Your ultimate guide through the world of trading.
Check Your Inbox!
In our email, you will find the Forex 101 book. Just tap the button to get it!
Risk warning: ᏟᖴᎠs are complex instruments and come with a high risk of losing money rapidly due to leverage.
68.53% of retail investor accounts lose money when trading ᏟᖴᎠs with this provider.
You should consider whether you understand how ᏟᖴᎠs work and whether you can afford to take the high risk of losing your money.
2022-11-18 • Updated
Information is not investment advice
Victor Sperandeo is a famous trader who suggested a methodology to identify trend reversal based on false breakouts. We will examine this methodology below and bring some examples to demonstrate its use.
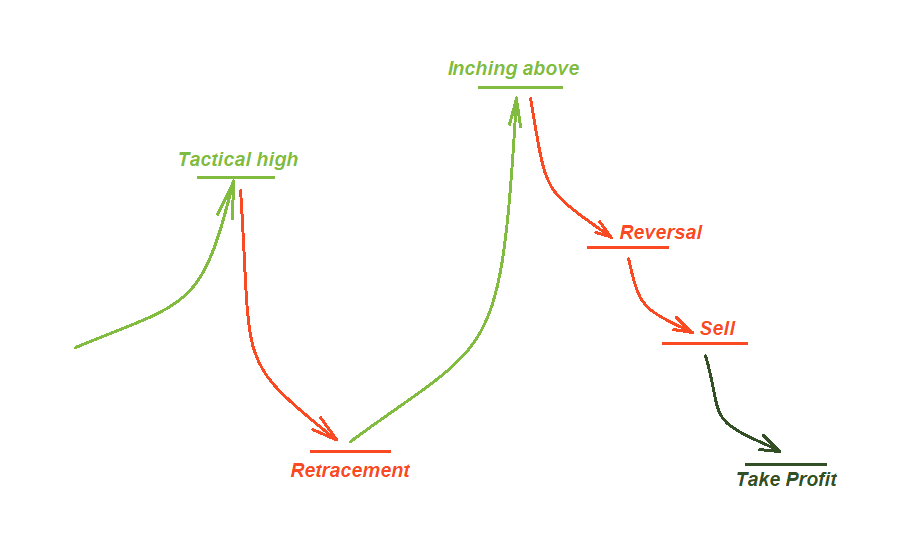
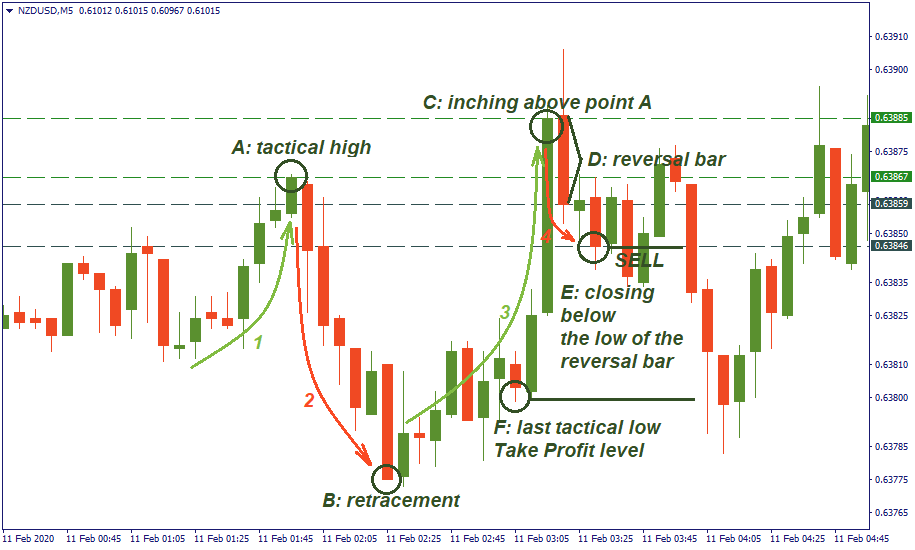
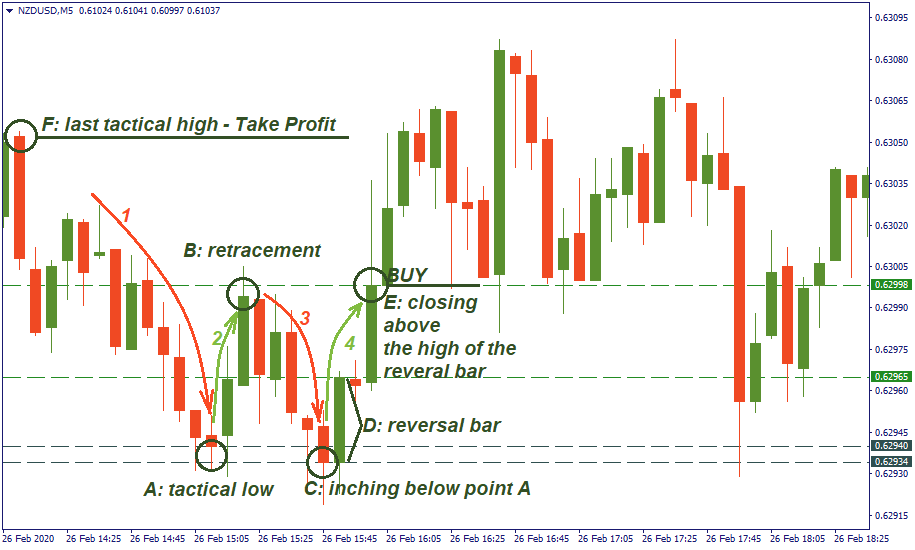
The methodology suggests that you can take any trend (be it bullish or bearish) on any timeframe. Essentially, you will be looking for a spot where the price inches beyond a recently formed high or low. If it does so and then quickly reverses, it is taken as an indication that a larger correction is about to take place – that is what you will use to make your profit.
The inner logic behind this approach is the hypothesis that if the market does not have the momentum to beat a recently formed high or low and just inches beyond it, it is likely to go into correction against the trend it was in when it made that high or low. Here is how it works.


Bill Williams is the creator of some of the most popular market indicators: Awesome Oscillator, Fractals, Alligator, and Gator.

Trend strategies are good - they may give significantly good results in any time frame and with any assets. The main idea of the ADX Trend-Based strategy is to try to catch the beginning of the trend.

Counter-trend strategies are always the most dangerous but also the most profitable. We are pleased to present an excellent counter-trend strategy for working in any market and with any assets.
Your request is accepted.
We will call you at the time interval that you chose
Next callback request for this phone number will be available in 00:30:00
If you have an urgent issue please contact us via
Live chat
Internal error. Please try again later