


Williams’ Strategy
Bill Williams is the creator of some of the most popular market indicators: Awesome Oscillator, Fractals, Alligator, and Gator.

Don’t waste your time – keep track of how NFP affects the US dollar!
Data Collection Notice
We maintain a record of your data to run this website. By clicking the button, you agree to our Privacy Policy.

Beginner Forex Book
Your ultimate guide through the world of trading.

Check Your Inbox!
In our email, you will find the Forex 101 book. Just tap the button to get it!
Risk warning: CFDs are complex instruments and come with a high risk of losing money rapidly due to leverage.
66.43% of retail investor accounts lose money when trading CFDs with this provider.
You should consider whether you understand how CFDs work and whether you can afford to take the high risk of losing your money.
Warning! Old version of the browser!
Press one of the icons below to proceed to the official website of the developer and download the latest version of your browser.

Online Forex broker
2022-09-19 • Updated
Information is not investment advice
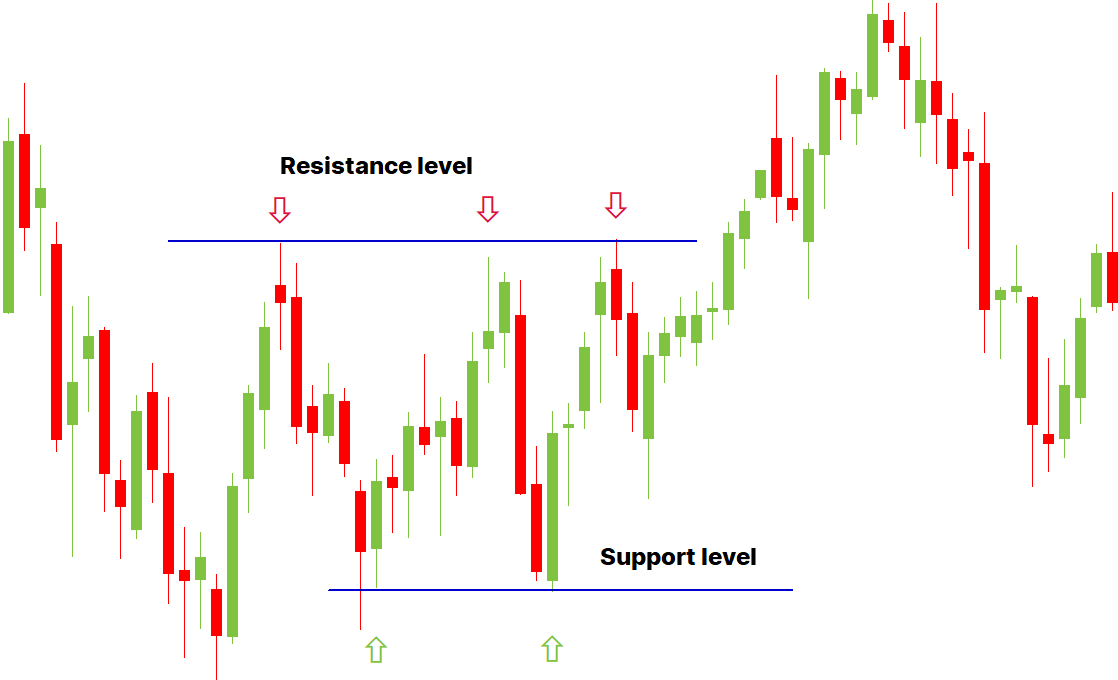
Support, or a support level, is a price level below which a price doesn’t fall for a longer period of time. Support levels are formed when a price starts to decline. At some point the price attracts the interest of buyers who start entering the market and boosting the price.
Resistance, on the other hand, is a price level from which a price bounces off after rising. Once a price reaches a certain level, sellers begin to sell the asset, creating resistance and not letting the price climb up even higher.
Today you’ll learn the differences between resistance and support levels, how to identify and draw them on a chart, and what support and resistance indicators and strategies you can use in trading.
As you can see, support and resistance are the reactions of the traders to price movements. The difference between them is that support is provided by buyers in response to the price decrease while resistance is how sellers react to the upward movement. Support and resistance also represent the supply and demand in the market: when there are more buyers than sellers and the demand is high, they provide support and the price rises, and vice versa.
Identifying support and resistance levels is helpful when you plan your trading strategy. There are multiple aspects you can analyze to try and find support and resistance levels, including:
There are multiple methods you can use to identify and draw support and resistance lines. Here are some of them.
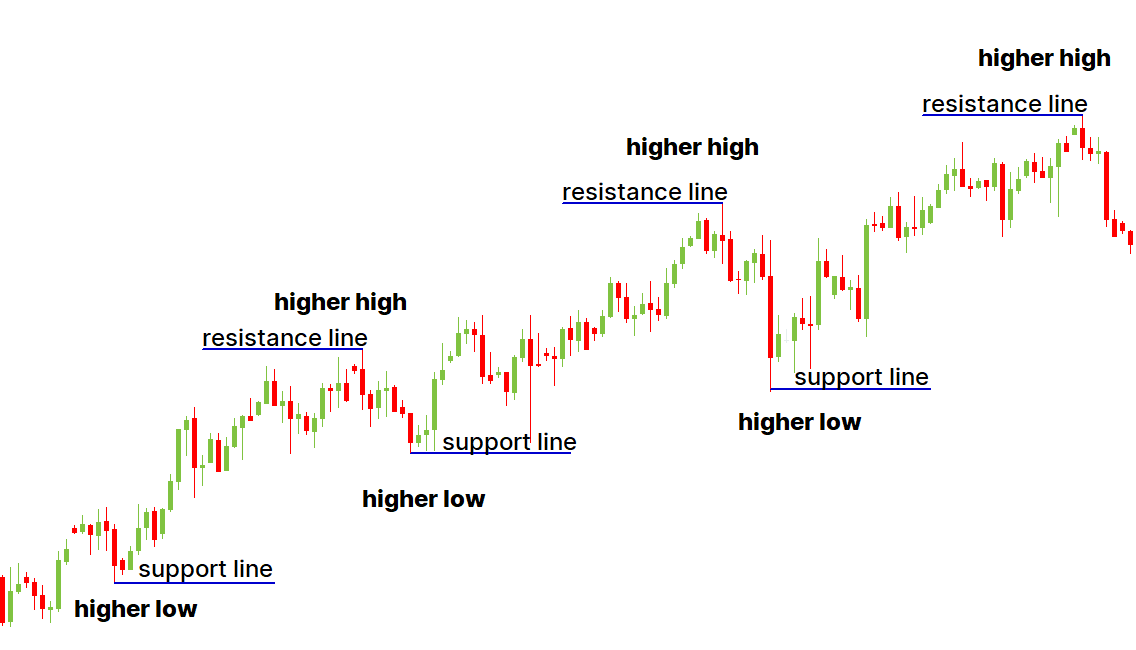
Find peaks and troughs. To do this, you need to find the highest and the lowest points on the chart within a certain timeframe and mark every peak and trough you see. Depending on the direction of the trend, the peaks and troughs will coincide with the support and resistance lines. For example, on this chart you can see that in an uptrend the support lines are located at the higher lows while resistance lines are at the higher highs. In a downtrend, on the other hand, support lines are drawn at the lower lows and the resistance lines are at the lower highs.
Look at the previous timeframes. With this method you need to examine several timeframes, one short (10-15 minutes) and a couple longer ones (1 hour or more). If the support and resistance lines in the longer timeframes are similar to those of the shorter timeframe, they are considered strong and reliable and can be used in your trading.
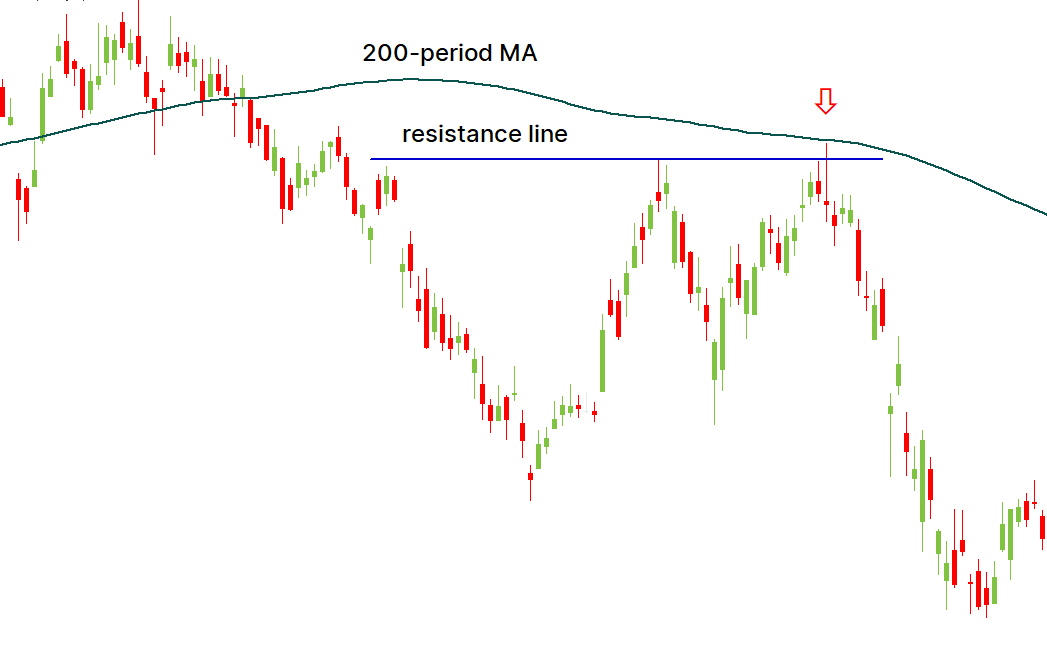
Use moving averages. You can also draw support and resistance lines with the help of the moving average indicator. To do this, you need to identify the direction the trend is moving in. During an upward movement the moving average acts as support, while in a downward movement it works as a resistance line. But keep in mind that moving averages show dynamic support and resistance, which change with the price and aren’t as reliable as static support and resistance lines. So moving averages shouldn’t be used without another back-up method.
Many traders plan their trading strategy around support and resistance levels. It’s very simple: buy when the price is near a support line and sell when the price is near the resistance line. Still, in order to maximize your profit, it’s important to wait for a confirmation that the support or resistance level will hold before making a decision.
It’s also better to choose when you want to exit your trade in advance. If you see strong support and resistance levels, you can use them to your advantage: buy just before the price reaches a strong support level and sell before it bounces off of strong resistance. However, this strategy is way riskier as you don’t know in advance whether the price will bounce out of the level or not.
It would help if you remembered about a Stop Loss order. Usually, a trader places this order below the closest support level. However, it’s often to see a fake breakout of such levels. Thus, we suggest moving your stop loss a little bit further from the support line. This way, you’ll make your trade a little bit less profitable but safer against chaotic price movements.
A Take Profit order is usually placed at the closest resistance line. Unlike Stop Losses, which close your order completely, a Take Profit can be split into several pieces to close your position partly at different resistance lines. This way, you would be able to make your trade risk-free and earn more money in case the price moves in the needed direction.
Let’s start with the definition of “swing highs and lows”(swing trading). A swing high is a high price within a price movement. While moving up or down, the price does it in waves, so the swing high refers to the high price within the waves, before it goes back down. Contrary, a swing low refers to the low price within the waves, before it goes back up.
It’s one of the simplest techniques. You will find everything on the price chart and you won’t even require any tools or indicators. All you need to do is to mark the closest previous highs and lows. Naturally, you should search for highs and lows that are close to the current price. Pick out the obvious levels, the ones the price couldn’t break and as a result reversed. It shouldn’t be an accurate level as the price rarely stops at the exact same level, so it will be several pips higher or lower. To mark the level you found, draw a horizontal line.
Notice that the more the price is reversed from this level, the weaker it is. It happens because of the psychology of trading. Almost every trader places a Stop Loss near the support or resistance line. Thus, market manipulators are willing to take this money from retail traders. More touches of the support line mean more money below it, so be careful.
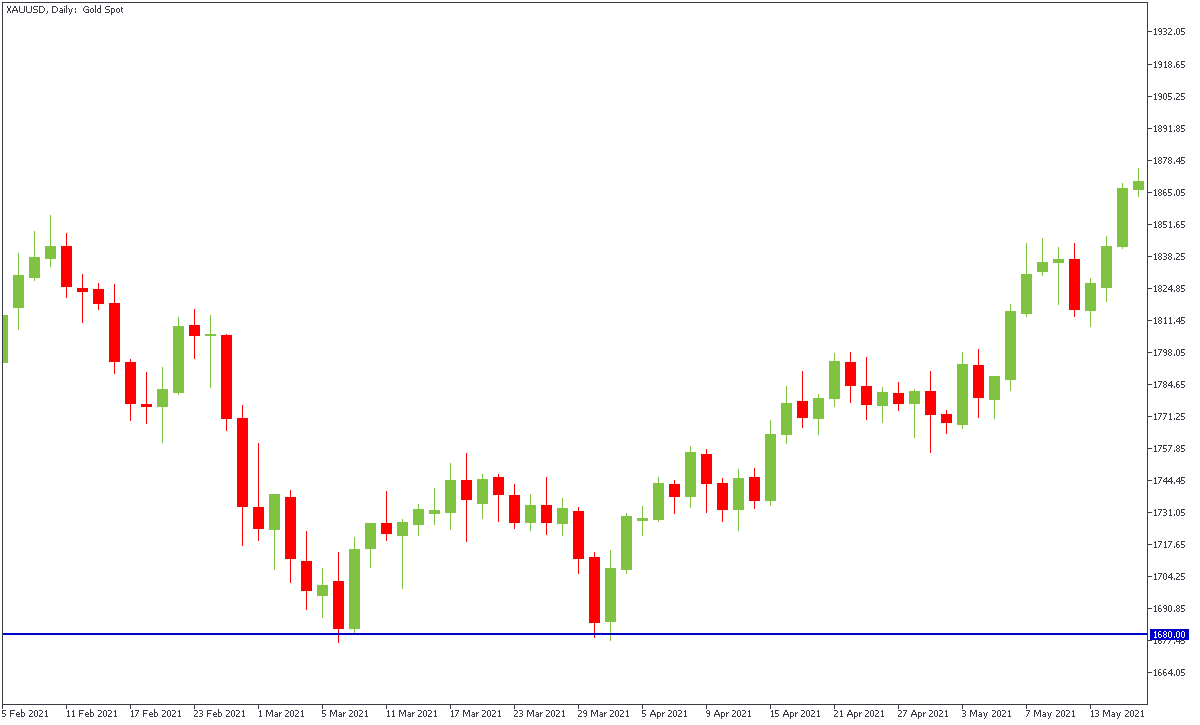
Have a look at the chart. The level of $1680 appeared to be strong support for XAUUSD. The asset rebounded from it two times: at the beginning and end of March.
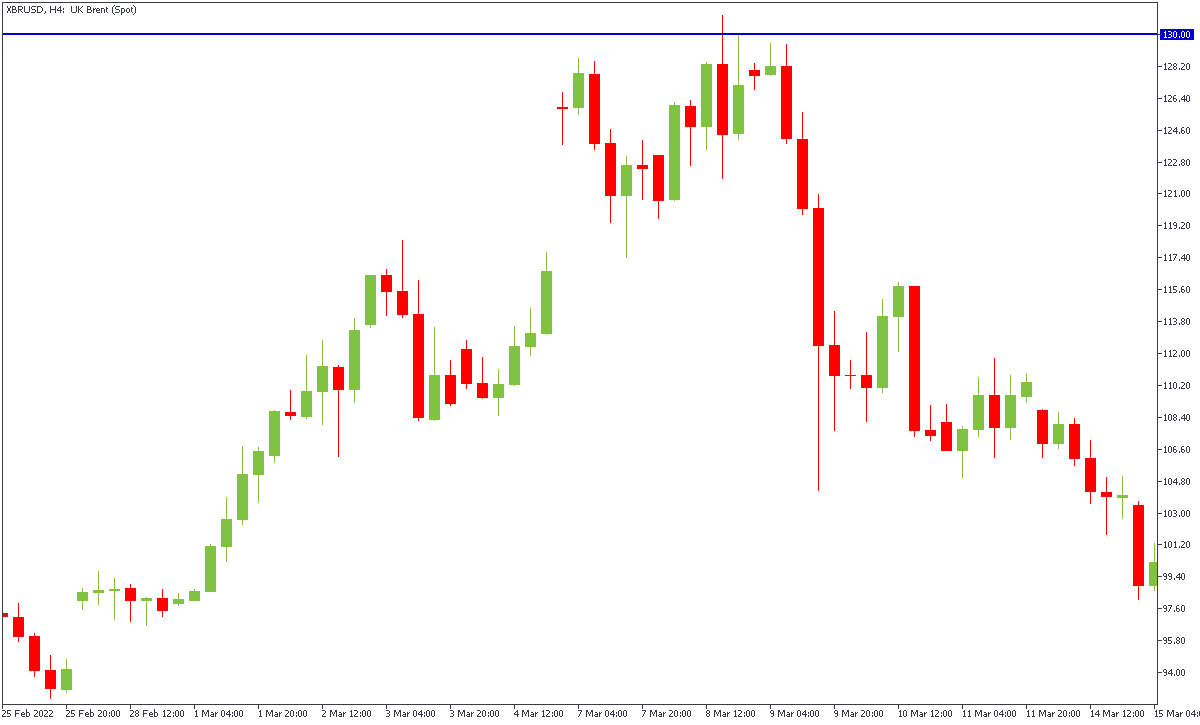
A psychological level appears when its price quote ends with 0 (the more zeros the level has, the more important it is). For example, 1.50, 90.00, etc. Psychological levels appear because of human nature. For example, if you ask a person about his/her expectations on the future price of the GBPUSD pair, it’s unlikely the person will say 1.3028-1.4123. More likely, they will forecast 1.30-1.40. According to this logic, when traders place orders, they choose “round” numbers, and as a result, the pair trades within these numbers.
Let’s have a look at the chart. XBRUSD couldn’t break the $130.00 level. And even when it broke the level, it couldn’t gain a foothold above it.
You should always remember that a trend is your friend and it helps you in various trading situations. It’s not difficult to determine a trend. Have a look at the chart. If you see that a price continues its movement up or down for a long time, it’s a trend. Higher highs and higher lows define an uptrend. Vice versa, lower highs and lower lows determine a downtrend.
When looking for a trend, you should remember that the line can’t be horizontal and it should connect at least 2 points (2 highs or 2 lows). Moreover, the second point through which you draw the trendline should be 20-30 candles away from the first one.
The more times the price touches the trendline, the stronger the trend is.
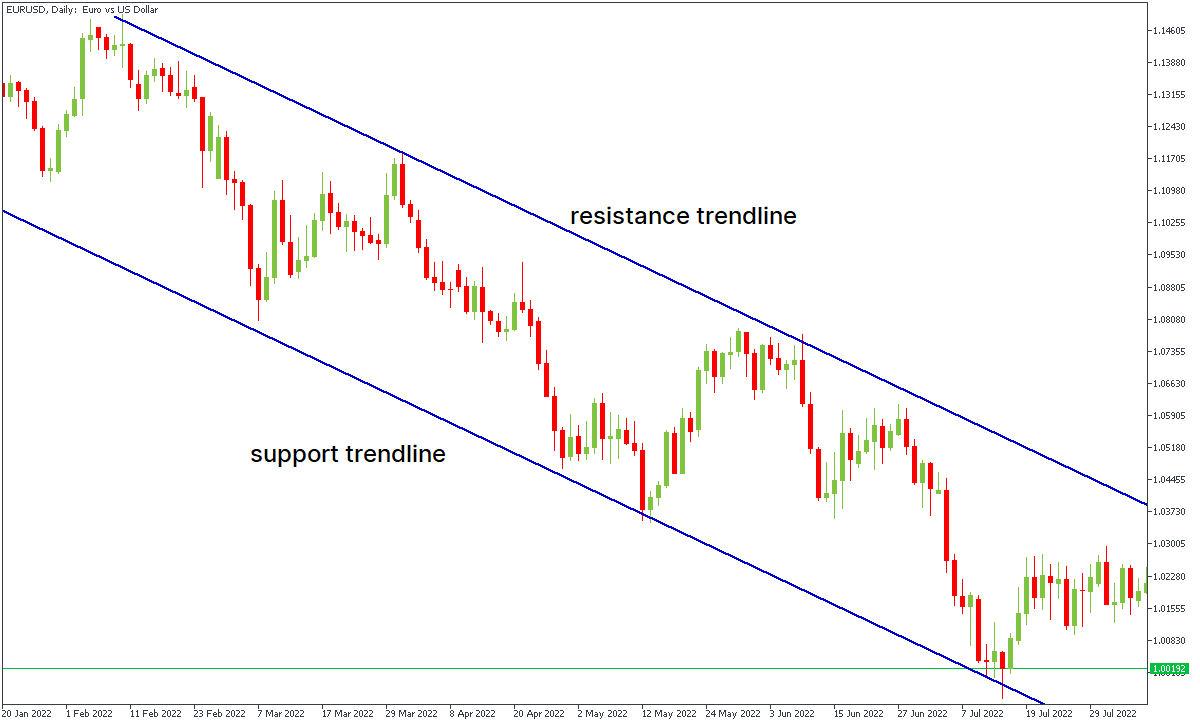
Let’s look at the chart of EURUSD. There you can see the downtrend. All you need to do is to draw a trendline through each peak. As a result, the line will be a resistance for the pair. You also can draw a line through lows and you will get the support level.
The same technique will work for the uptrend.
When you implement the indicator, you will see 3 resistance levels, 3 support levels and a pivot point that is a border to determine the further movement of a price. If it trades above the pivot point, the movement is supposed to be bullish, otherwise, the bearish move is anticipated.
Resistance and support levels show accurate aims of the asset depending on a timeframe you choose. One of the advantages of the pivot point indicator is that levels change every time the timeframe you’ve chosen ends.
Note: you can choose any timeframe, however, we recommend you to use the weekly one. The indicator will show weekly aims for the pair, so you will be able to make a longer-term trading plan.
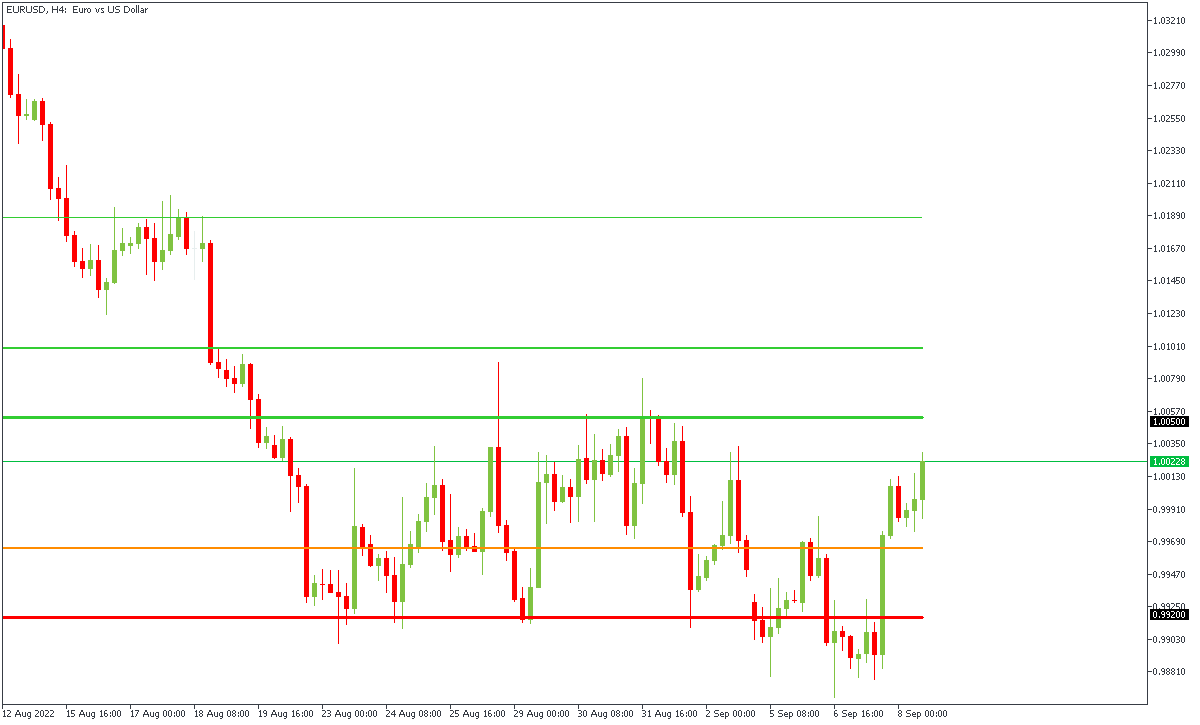
Have a look at the chart. You can see that at the end of the week, the pair broke the support of 0.9920. However, later it reversed to the closest resistance of 1.0050. Also, notice that both support and resistance lines worked amazing, especially for a technical indicator that is calculated by itself.
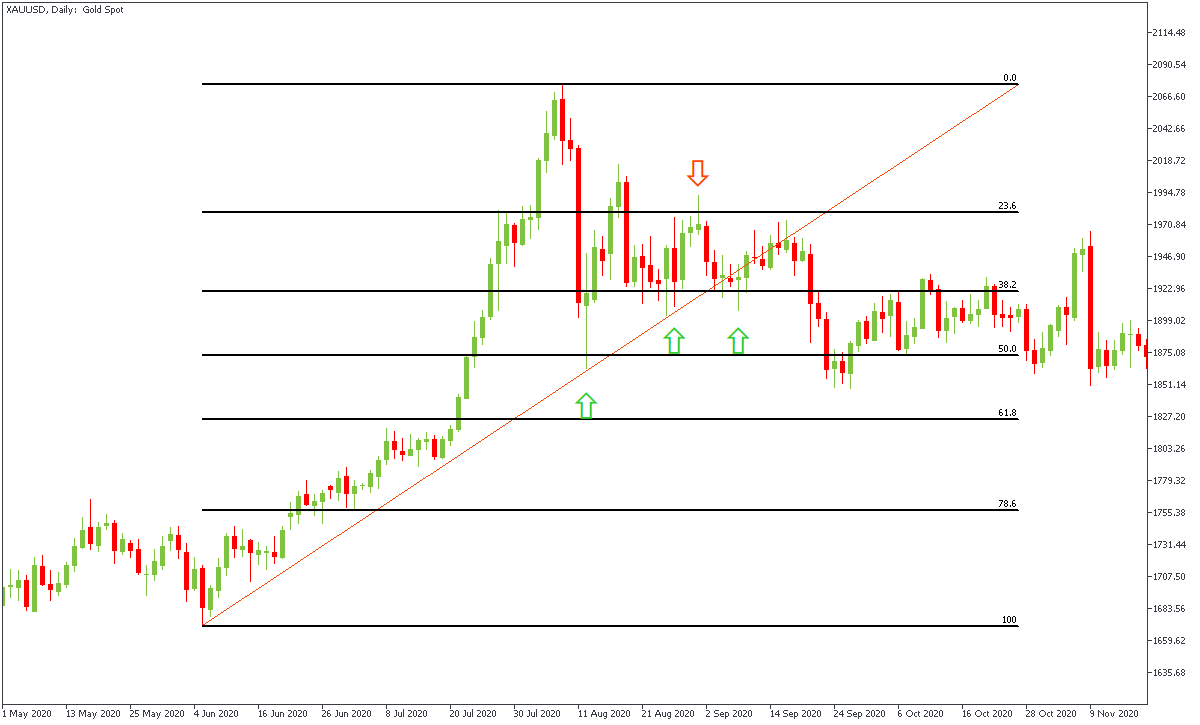
The Fibonacci tool is used to set resistance and support levels or to predict the potential scope of a price movement. Its main goal is to find a possible correction against the main trend. The key levels of the Fibonacci retracements are 38.2%, 50%, and 61.8%, they indicate the strongest support or resistance, depending on the direction of the price.
Let’s look at the chart of EUR/USD. You can see that the pair bounced from the 50.0 Fibo level and is moving to 23.6, which became a resistance for EUR/USD.
Support and resistance levels are very important areas on the price chart. Support and resistance can tell you when is the best time to enter or exit a trade and where to put stop and limit orders to minimize the risk. These levels are used in many trading indicators and strategies, and knowing how to utilize them is a must for any trader.
Yes, they do. Resistance levels identify areas of supply for a particular cryptocurrency. When the supply is higher than the demand, the sellers dominate the market and the price of the cryptocurrency goes down.
Support and resistance levels help traders identify possible exits from a trade. Selling stocks once their price reaches one of the resistance levels is a safe and logical step as the price will likely bounce off of the level and start to decrease.
In order to see if support and resistance were broken, you need to wait for a confirmation of price action. If the price doesn’t bounce off of the support or resistance level, it will continue to move in the same direction (up past the resistance level or down past the support level), which means that these levels were broken.
Support and resistance levels help traders decide when is the best time to buy or sell assets. Generally, traders try to buy near support levels in an uptrend and sell near resistance levels in a downtrend.
Depending on what style of trading you prefer, you can use any timeframe to draw resistance lines. Day traders mainly use M30, swing traders use H4 and Daily timeframes and long-term traders use Weekly and Monthly timeframes. However, longer timeframes tend to indicate stronger resistance levels.

Bill Williams is the creator of some of the most popular market indicators: Awesome Oscillator, Fractals, Alligator, and Gator.

Trend strategies are good - they may give significantly good results in any time frame and with any assets. The main idea of the ADX Trend-Based strategy is to try to catch the beginning of the trend.

Counter-trend strategies are always the most dangerous but also the most profitable. We are pleased to present an excellent counter-trend strategy for working in any market and with any assets.


Your request is accepted.
We will call you at the time interval that you chose
Next callback request for this phone number will be available in 00:30:00
If you have an urgent issue please contact us via
Live chat
Internal error. Please try again later