


Williams’ Strategy
Bill Williams is the creator of some of the most popular market indicators: Awesome Oscillator, Fractals, Alligator, and Gator.

Don’t waste your time – keep track of how NFP affects the US dollar!
Data Collection Notice
We maintain a record of your data to run this website. By clicking the button, you agree to our Privacy Policy.

Beginner Forex Book
Your ultimate guide through the world of trading.

Check Your Inbox!
In our email, you will find the Forex 101 book. Just tap the button to get it!
Risk warning: ᏟᖴᎠs are complex instruments and come with a high risk of losing money rapidly due to leverage.
66.43% of retail investor accounts lose money when trading ᏟᖴᎠs with this provider.
You should consider whether you understand how ᏟᖴᎠs work and whether you can afford to take the high risk of losing your money.
Warning! Old version of the browser!
Press one of the icons below to proceed to the official website of the developer and download the latest version of your browser.

Online Forex broker
2022-08-26 • Updated
Information is not investment advice
With experience every trader gains knowledge about support and resistance levels, trends and corrections and various technical indicators. With every month of active trading, it becomes easier to spot candlestick and chart patterns. Yet, you need to master some more complicated things to keep moving forwards. Let’s check them out.
Sometimes the price forms structures that go beyond a simple consolidation pattern or a wedge. The price action like this reflects the battle between buyers and sellers: there are periods when ones or others prevail but there also are periods when their powers are almost equal.
An example of a bearish Wolfe waves pattern
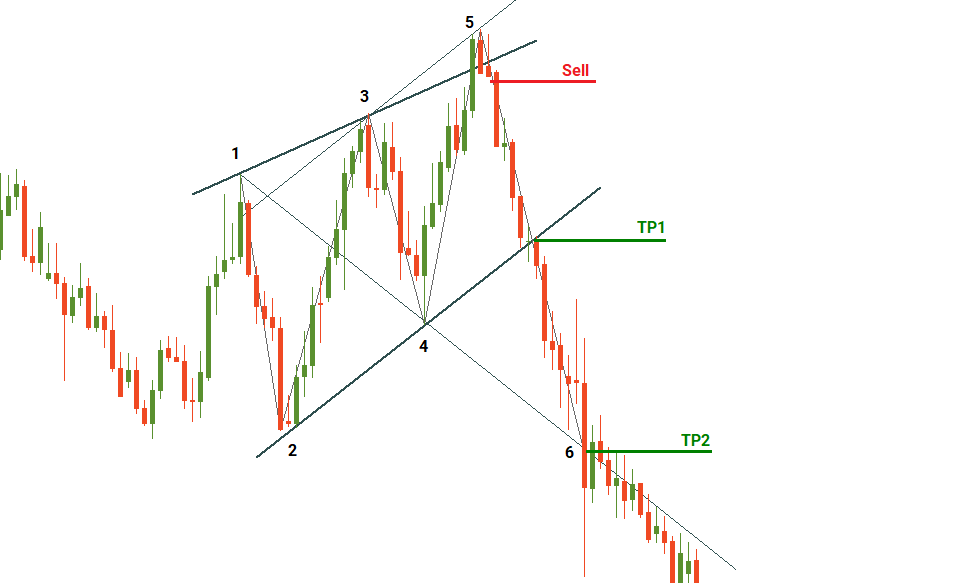
Look for a price shape that is similar to a wedge. Pay attention to the stage of the pattern. You will have to become alert once the price forms the first four points – in other words, a range that is getting narrower. After that, there may be three scenarios:
The third scenario reflects what we call ‘Wolfe waves’. If the points 3 and 4 are above the points 1 and 2 respectively, then be ready for a formation of a bearish Wolfe waves pattern. It’s really important that waves 1-2 and 2-3 are equal (symmetric). Fibonacci tools will also help a lot to confirm the pattern: point 3 is usually at the 127.2% or 161.8% extensions of the wave 1-2.
Pay attention to the point 5. A newbie would mistake it for a breakout, and it’s the tricky part. Point 5 is usually at the 127.2% or 161.8% extensions of the wave 3-4. In addition, there’s a specific graphic area between the 1-3 line and the line parallel to 2-4 drawn from the point 3: if the price reverses down in this ‘sweet zone’, it’s a sell signal. If it doesn’t, then the bearish Wolfe waves pattern isn’t confirmed.
Take profit and Stop Loss
The nice part is that the pattern provides traders with clear targets.
TP1: 2-4 support line.
TP2: Draw a line through points 1 and 4: the second target, the point 6, should lie at it. The movement between points 5 and 6 will be long and thus it will allow traders to get enough points of profit.
You can put a Stop Loss above the point 5.
Takeaway
If you see a reversal candlestick pattern in the ‘sweet zone’, cheer up and consider trading with a big target (point 6). If the price goes beyond the ‘sweet zone’, it’s another pattern, so consider trading in the direction of a breakout.
Not so complicated after all? The main thing you’ll have to train is your eye: you will have to do the visual analysis of the price chart to recognize Wolfe waves on it.
Gartley pattern belongs to a group of the so-called harmonic patterns. These patterns (Crab, Butterfly, Bat, and Shark) are quite similar to each other. The difference between them lies in the exact proportions of the price swings. As for the logic and the recognition of these patterns, start with mastering Gartley, the rest will come easily.
The main difficulty with Gartley pattern is that it very much looks like a top of the market, and yet an advance the price will follow. Notice that in all bullish harmonic patterns, the second peak is lower when the first one. Moreover, the structure of a bullish pattern resembles the letter M, while a bearish pattern is just like the latter W.
Once you notice such a shape on a chart, the first thing that comes to your mind should be: the situation probably isn’t as simple as it looks. Take action: grab the Fibonacci retracement tool to check the positions of the key points.
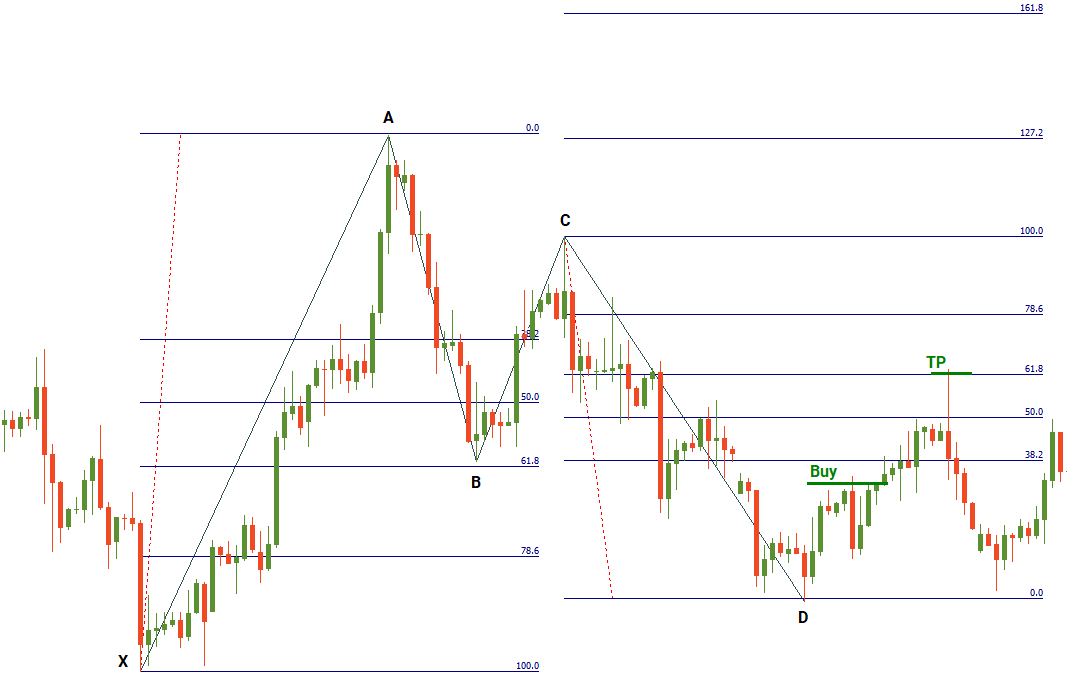
An example of a bullish Gartley pattern
Take profit and Stop Loss
TP1: 61.8% of CD.
TP2: the size of XA projected from D.
A Stop Loss may be placed below X for bullish Gartley (above X for bearish Gartley) or according to your risk management rules.
A problem with harmonic patterns is that in real life, patterns you find on charts often don’t fit in the ratios listed above perfectly. As a result, the bigger is the difference between the textbook Gartley pattern and the pattern you want to trade, the higher risk of an error should be taken into account.
Takeaway
Update the way you look at the market. Even if you decide not to use Gartley patterns for entry signals, you still have to be familiar with their shapes in order to avoid mistaking them for market tops or bottoms. You will be surprised at how often these patterns occur.
Here’s another tricky pattern. A beginner trader may mistake it for a healthy trending market. However, advanced traders should be able to avoid such a mistake.
A pattern like this occurs in a distinctive trend. In other words, the market that had direction for some period. Then, you notice that the swings the price swings started to look really similar in size and shape. This should tell you: be attentive, the trend is likely to change direction!
As with the previous two patterns, you will find some Fibonacci ratios in this one.
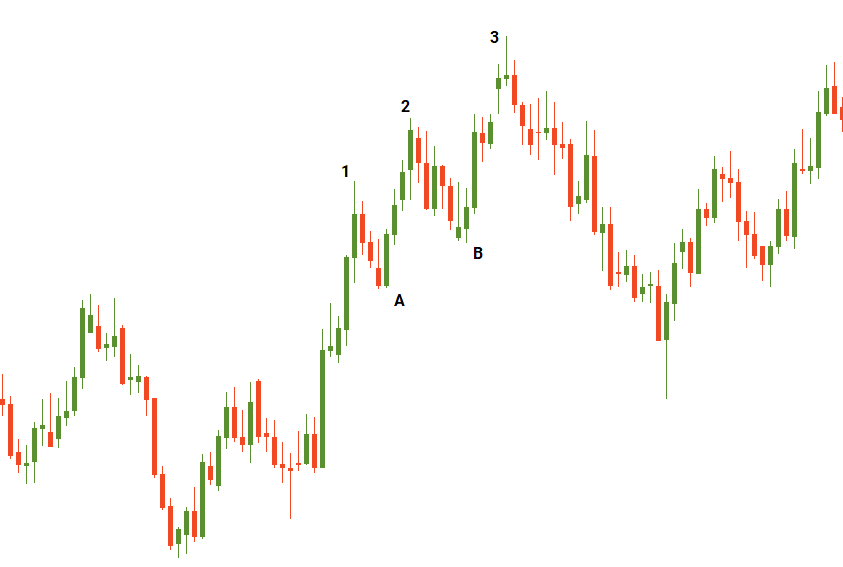
An example of a bearish Three drives pattern
It’s not like you will need to memorize these ratios or something. The retracement of 61.8% is quite natural and you may visually memorize how it looks.
Takeaway
Sometimes trends end in a Double top or a Head and Shoulders patterns, but it happens that a trend runs out with a three similar swings. It’s really important to be aware of this pattern. Moreover, it provides great opportunities to open trades.

Bill Williams is the creator of some of the most popular market indicators: Awesome Oscillator, Fractals, Alligator, and Gator.

Trend strategies are good - they may give significantly good results in any time frame and with any assets. The main idea of the ADX Trend-Based strategy is to try to catch the beginning of the trend.

Counter-trend strategies are always the most dangerous but also the most profitable. We are pleased to present an excellent counter-trend strategy for working in any market and with any assets.


Your request is accepted.
We will call you at the time interval that you chose
Next callback request for this phone number will be available in 00:30:00
If you have an urgent issue please contact us via
Live chat
Internal error. Please try again later