


Williams’ Strategy
Bill Williams is the creator of some of the most popular market indicators: Awesome Oscillator, Fractals, Alligator, and Gator.

Don’t waste your time – keep track of how NFP affects the US dollar!
Data Collection Notice
We maintain a record of your data to run this website. By clicking the button, you agree to our Privacy Policy.

Beginner Forex Book
Your ultimate guide through the world of trading.

Check Your Inbox!
In our email, you will find the Forex 101 book. Just tap the button to get it!
Risk warning: ᏟᖴᎠs are complex instruments and come with a high risk of losing money rapidly due to leverage.
66.43% of retail investor accounts lose money when trading ᏟᖴᎠs with this provider.
You should consider whether you understand how ᏟᖴᎠs work and whether you can afford to take the high risk of losing your money.
Warning! Old version of the browser!
Press one of the icons below to proceed to the official website of the developer and download the latest version of your browser.

Online Forex broker
2019-11-11 • Updated
Information is not investment advice
Today we are going to explain a system which requires the usage of a moving average. It is a strategy developed by professional traders. It is called “Three ducks”. The name may seem strange, but it comes from a quite common phrase “get your ducks in a row”, which means to be well-prepared for a certain task or to become more efficient. Have you ever seen the family of ducks swimming in the lake? Usually, they tend to swim in a row. This is how this system works. It helps a trader to make a "row" of actions to achieve a better result. As with most of the setups, it is implemented during a trend.
So, what do we need to start using this system?
Three ducks trading system is as easy as a pie. It helps you to find the upward and downward movements in the market. You do not need to download complicated oscillators or look for specific patterns. All you need is to consider three timeframes: M5, H1, and H4. The only indicator that you need is the 60-period simple moving average, which you can find in any platform.
Analysts recommend implementing this system while trading EUR/USD or GBP/USD.
Let's look at what "ducks" make up this strategy. We will take the EUR/USD pair as an example.
The first duck
At first, we look at the largest timeframe (H4). We see if the current price is above or below the 60-period SMA.
On May 29, we could see that the 60-period MA was moving above the price on the H4 chart. That is, we will be looking for a selling opportunity.
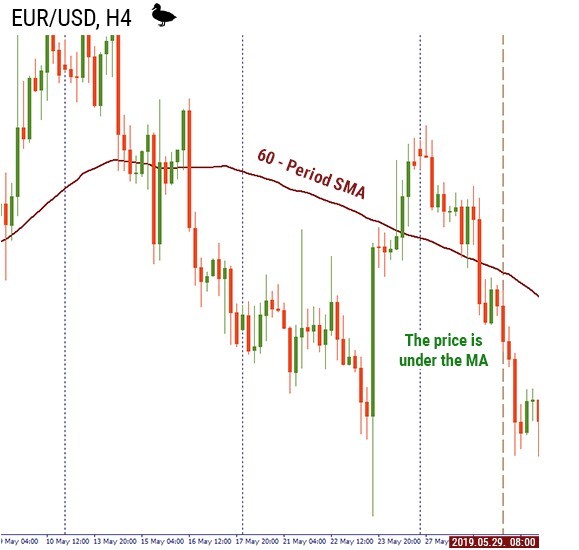
Ok, we caught the first duck! Let’s look if we can find more proofs on the smaller timeframes.
The second duck
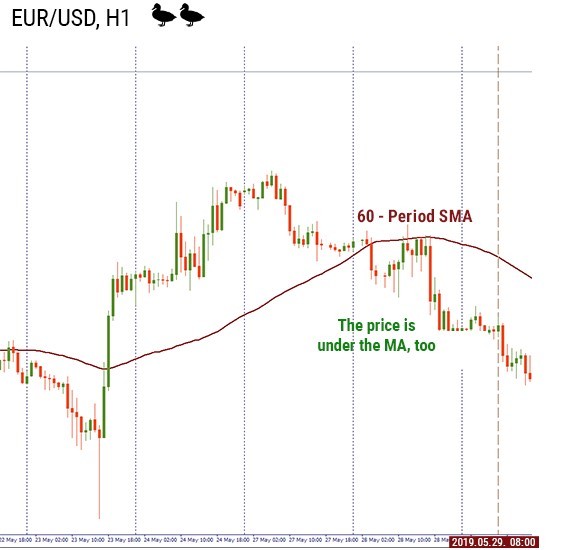
During the second step, we look at the H1 chart.
Important notice! If the conditions above are not met and the price acts differently than at the first step, we cannot move to step 3.
On the H1, EUR/USD was placed below the 60-period SMA. So, we felt confident enough to consider the third step.
The third duck
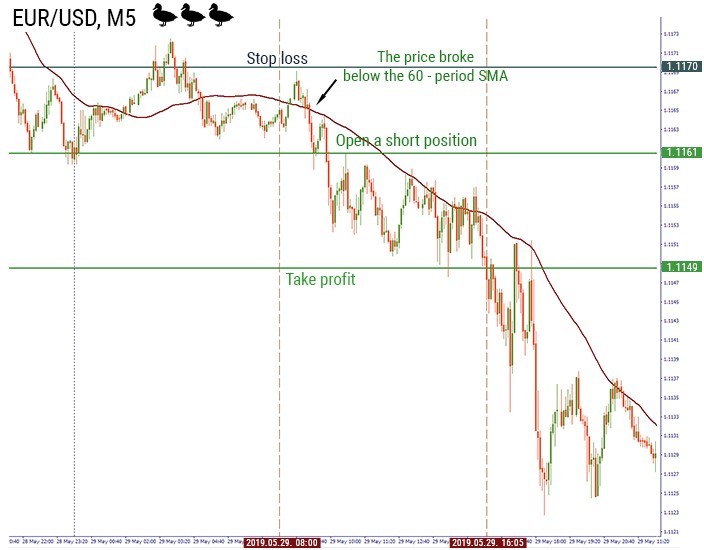
Now, on the M5 chart, we are waiting for a crossover.
This situation would mean that price on all of the charts (all of the “ducks”) are moving in the same direction.
When you place you take profit?
You can place your take profit near the previous minimums or maximums, or trail your stop and follow the direction of the price.
Let’s look at the final example.
On M5, we waited for the price to cross the moving average from top to bottom and waited for it to break the previous local minimum. We opened a short position at 1.1161. Our stop loss was placed at 1.1170 (above the previous high) and we took profit higher than the previous support at 1.1149.
Conclusion
This strategy helps you to consider the price movements and use them in order to find more profitable opportunities.

Bill Williams is the creator of some of the most popular market indicators: Awesome Oscillator, Fractals, Alligator, and Gator.

Trend strategies are good - they may give significantly good results in any time frame and with any assets. The main idea of the ADX Trend-Based strategy is to try to catch the beginning of the trend.

Counter-trend strategies are always the most dangerous but also the most profitable. We are pleased to present an excellent counter-trend strategy for working in any market and with any assets.


Your request is accepted.
We will call you at the time interval that you chose
Next callback request for this phone number will be available in 00:30:00
If you have an urgent issue please contact us via
Live chat
Internal error. Please try again later