

Williams’ Strategy
Bill Williams is the creator of some of the most popular market indicators: Awesome Oscillator, Fractals, Alligator, and Gator.

Don’t waste your time – keep track of how NFP affects the US dollar!
Data Collection Notice
We maintain a record of your data to run this website. By clicking the button, you agree to our Privacy Policy.

Beginner Forex Book
Your ultimate guide through the world of trading.

Check Your Inbox!
In our email, you will find the Forex 101 book. Just tap the button to get it!
Risk warning: ᏟᖴᎠs are complex instruments and come with a high risk of losing money rapidly due to leverage.
70.72% of retail investor accounts lose money when trading ᏟᖴᎠs with this provider.
You should consider whether you understand how ᏟᖴᎠs work and whether you can afford to take the high risk of losing your money.
Warning! Old version of the browser!
Press one of the icons below to proceed to the official website of the developer and download the latest version of your browser.

Online Forex broker
2022-11-18 • Updated
Information is not investment advice
If you are familiar with the price action method, you should know the “Third candle” pattern. The pattern is proven to be simple and effective for traders. In this article, we are going to consider the strategy, which is based on this pattern.
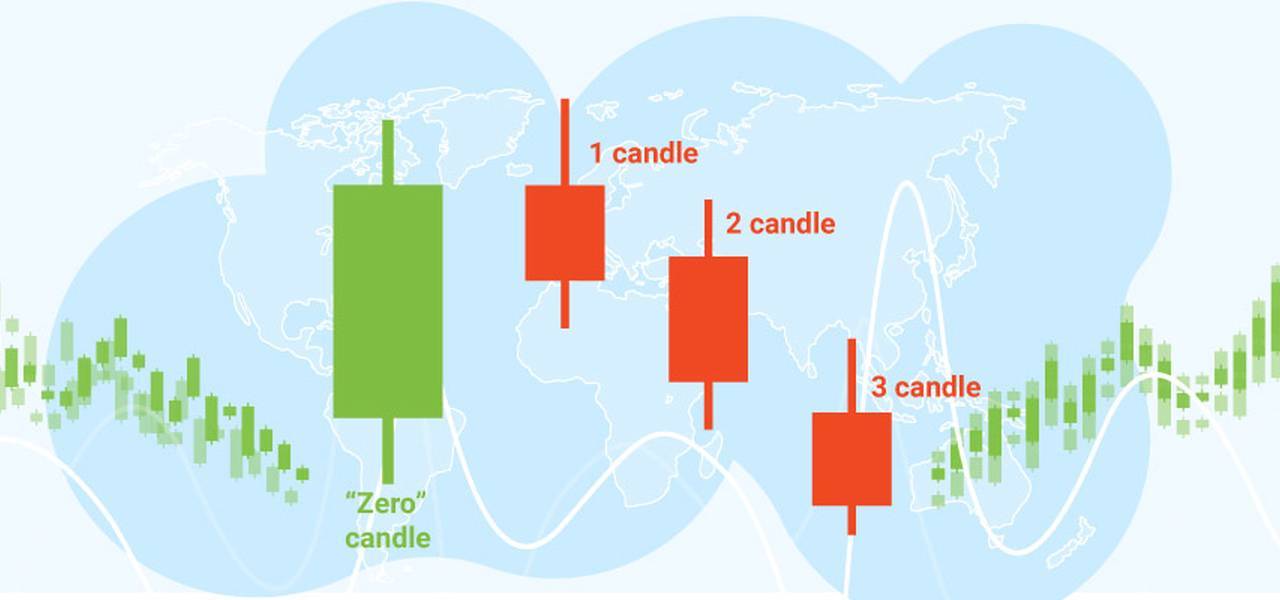
The pattern that we are going to explain is a reversal one. Traders often confuse it with the “Three black crows” or the “Three white soldiers” patterns. The main difference between them is that the “Third candle” pattern has fewer restrictions concerning the opening price of each candlestick.
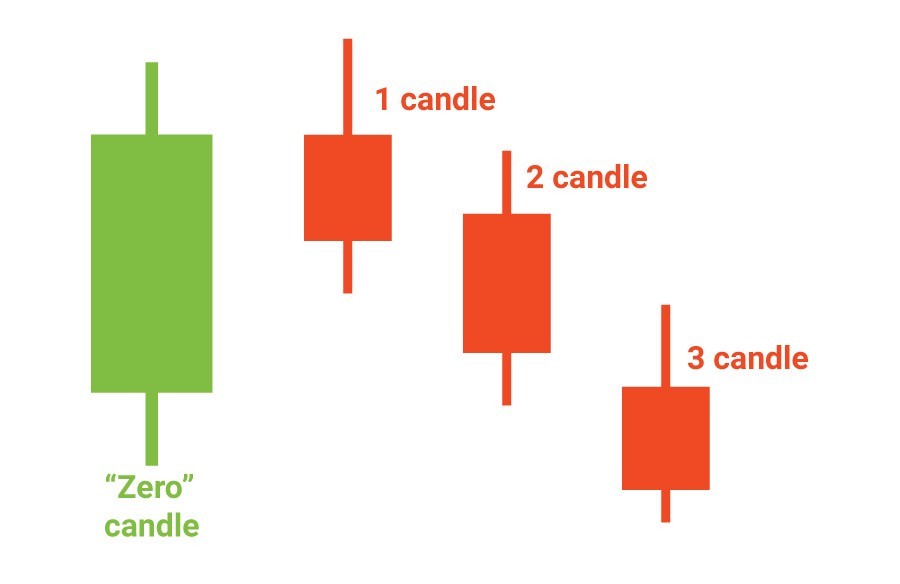
The formation of a bearish pattern that signals the reversal to the downside begins with a bearish candle (1st candle on the picture) with a higher high which should follow the bullish (“zero”) candlestick. After that, we wait for the second bearish candle which confirms the downward movement. When it is closed we may say that the pattern is implemented on the chart. The third candle is used for opening a short position.
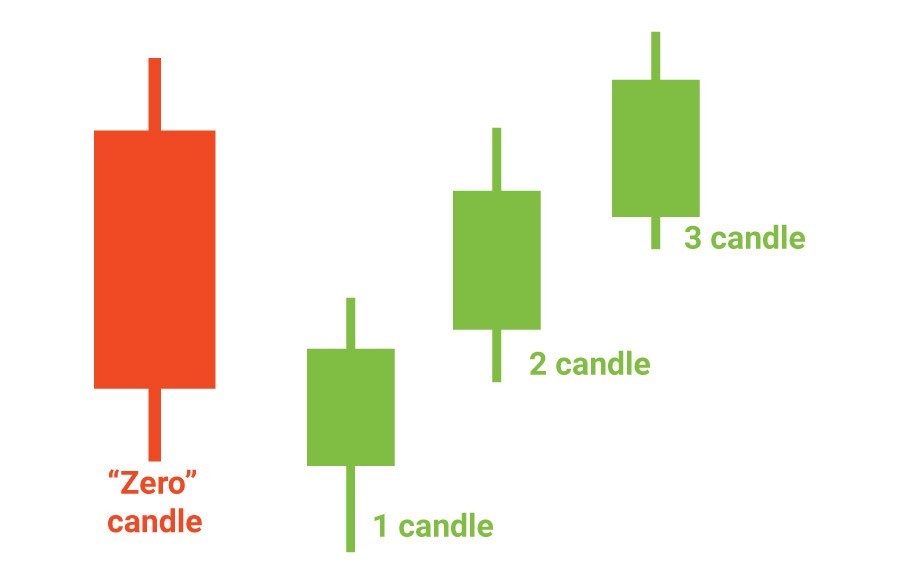
Vice versa, we identify the bullish pattern. The first bullish candlestick should appear after the bearish one (“zero”). It should have a lower low. The second bullish candlestick is used as a confirmation of the reversal to the upside. The opening price of the third candlestick is the level where we open a long position.
Now, let's look at the algorithm of the strategy.
It’s recommended to implement the strategy during the European and American trading sessions on the intraday timeframes. Also, you should add a stochastic indicator (5, 3, 3) to your chart as a filter.
Below we provided an example of the strategy.
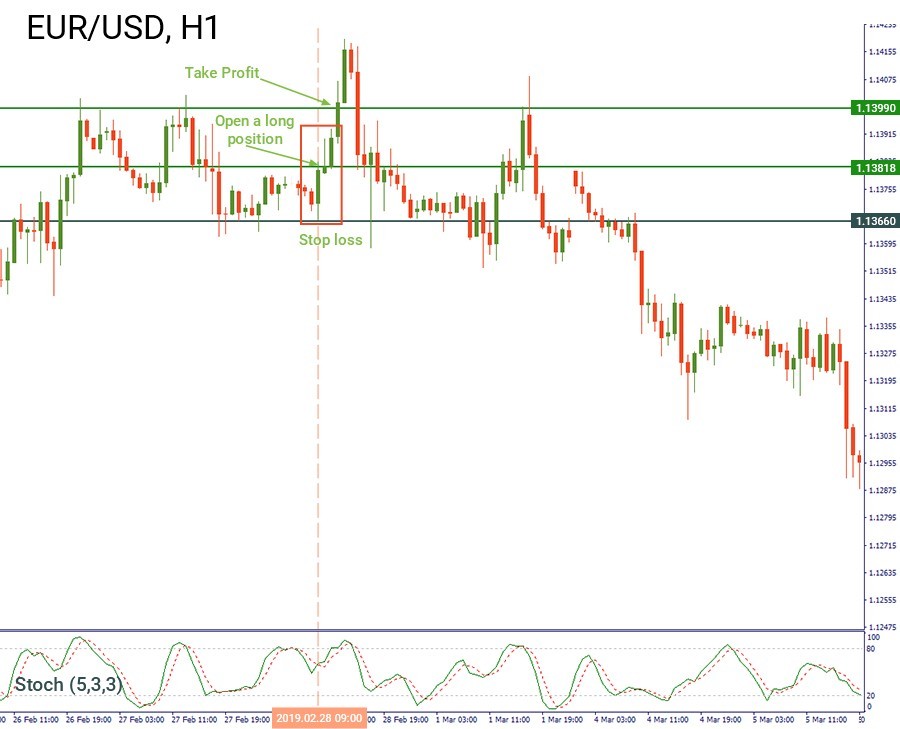
On the H1 chart of EUR/USD, we noticed that the low of the bullish candlestick inched lower than the low of the previous bearish one on February 28. The second candlestick confirmed the move to the upside and the stochastic is moving up. We opened a long position at the opening price at 1.13818. The level of stop loss is placed at the low of the first candlestick at 1.1366. We trailed the level of take profit and closed the position a little bit below the resistance level at 1.1399.
The scenario of opening a short position is similar to the one described above. Follow these steps:
The example of a short trade is shown in the chart below.
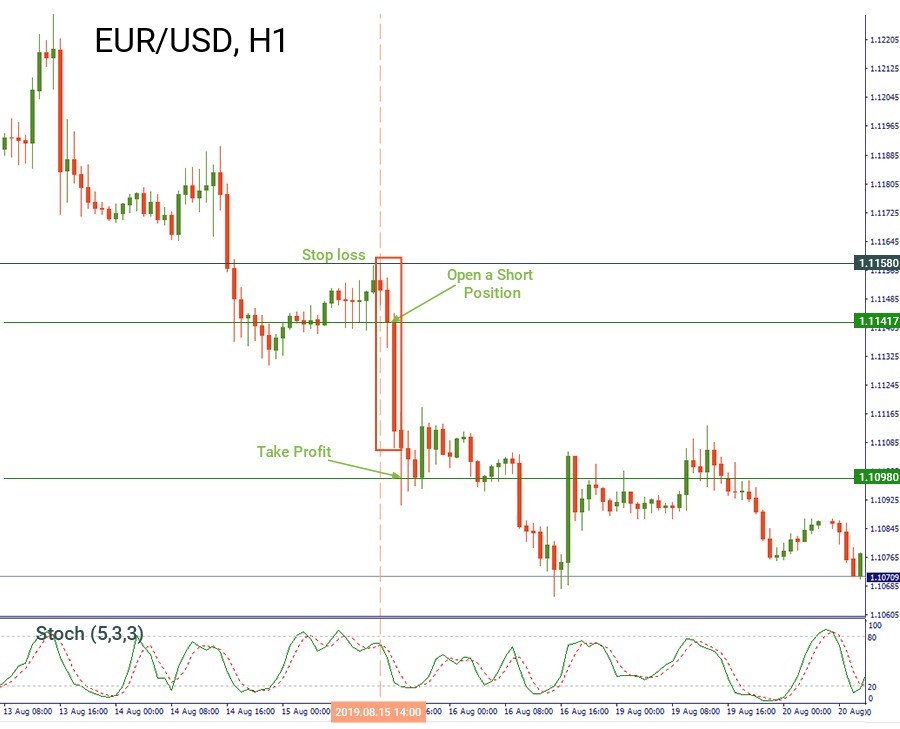
On the H1 chart of EUR/USD, we can see the formation of the "Third candle" pattern. Also, we noticed that the stochastic oscillator was moving down. We opened a short position at the opening price of the third candle at 1.1141. Stop loss is placed at the high of the first candlestick at 1.1158. We trailed our position and closed it when a stochastic oscillator was about to form a crossover within the oversold zone. We closed it at 1.1098.
The "Third candle" strategy represents an easy type of price action method. It is very understandable and may help with your intraday trading decisions.

Bill Williams is the creator of some of the most popular market indicators: Awesome Oscillator, Fractals, Alligator, and Gator.

Trend strategies are good - they may give significantly good results in any time frame and with any assets. The main idea of the ADX Trend-Based strategy is to try to catch the beginning of the trend.

Counter-trend strategies are always the most dangerous but also the most profitable. We are pleased to present an excellent counter-trend strategy for working in any market and with any assets.


Your request is accepted.
We will call you at the time interval that you chose
Next callback request for this phone number will be available in 00:30:00
If you have an urgent issue please contact us via
Live chat
Internal error. Please try again later