


Williams’ Strategy
Bill Williams is the creator of some of the most popular market indicators: Awesome Oscillator, Fractals, Alligator, and Gator.

Don’t waste your time – keep track of how NFP affects the US dollar!
Data Collection Notice
We maintain a record of your data to run this website. By clicking the button, you agree to our Privacy Policy.

Beginner Forex Book
Your ultimate guide through the world of trading.

Check Your Inbox!
In our email, you will find the Forex 101 book. Just tap the button to get it!
Risk warning: ᏟᖴᎠs are complex instruments and come with a high risk of losing money rapidly due to leverage.
70.72% of retail investor accounts lose money when trading ᏟᖴᎠs with this provider.
You should consider whether you understand how ᏟᖴᎠs work and whether you can afford to take the high risk of losing your money.
Warning! Old version of the browser!
Press one of the icons below to proceed to the official website of the developer and download the latest version of your browser.

Online Forex broker
2022-08-26 • Updated
Information is not investment advice
When you give a first glance at the Ichimoku indicator, it may hurt your eye. Just take a look at the picture below.
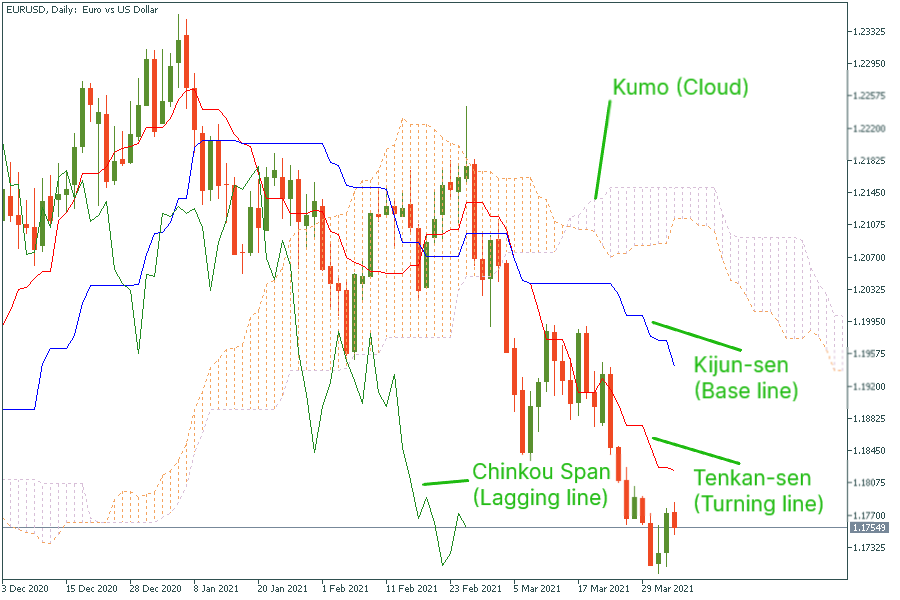
Let these sharp lines and stripes not scare you! In this article, we will teach you how to use this complicated tool for your successful trading decisions.
Ichimoku Kinko Hyo (Ichimoku) is a complex and very informative technical indicator. In Japanese, it means a “glance at a chart in equilibrium”. In this article, we will provide a brief explanation of indicator’s purposes and elements needed for our strategy. If you want to go into the depth of trading with Ichimoku, we recommend you to visit the FBS Guidebook.
There are five main parts of the Ichimoku indicator.
What Ichimoku is useful for?
Ichimoku is great when you need to identify the direction and the strength of a trend. It also helps to set support and resistance levels. Most importantly for us, Ichimoku can be used for building an effective trading system.
For the strategy we are going to explain below, we need the Stochastic Oscillator with customized settings that will be used as a filter.
Timeframe: daily
Currency pairs: majors
Indicators: Ichimoku (default);
Stochastic oscillator with the following settings:
%K period = 5; %D period = 3; Slowing = 3.
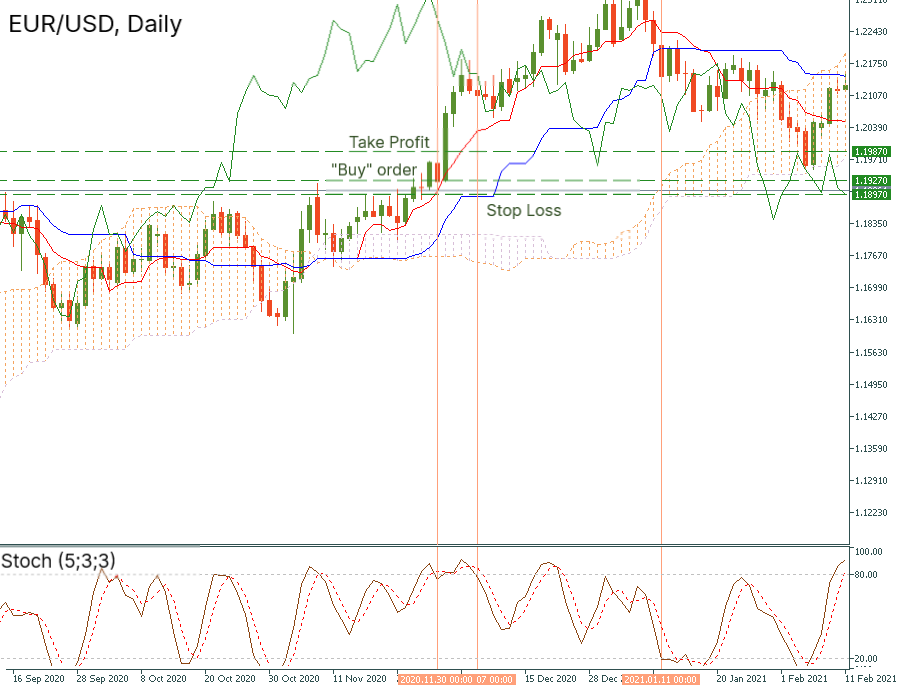
Example: On the daily chart of EUR/USD, the price was trading above the Kijun-sen and the cloud. On November 30, the stochastic oscillator crossed in the overbought zone. We opened the long trade at the opening price of the next candlestick at 1.1927. The Stop Loss was placed at 1.1897, 30 pips below the opening price. The Take Profit was located at 1.1987 (60 pips above the initial order).
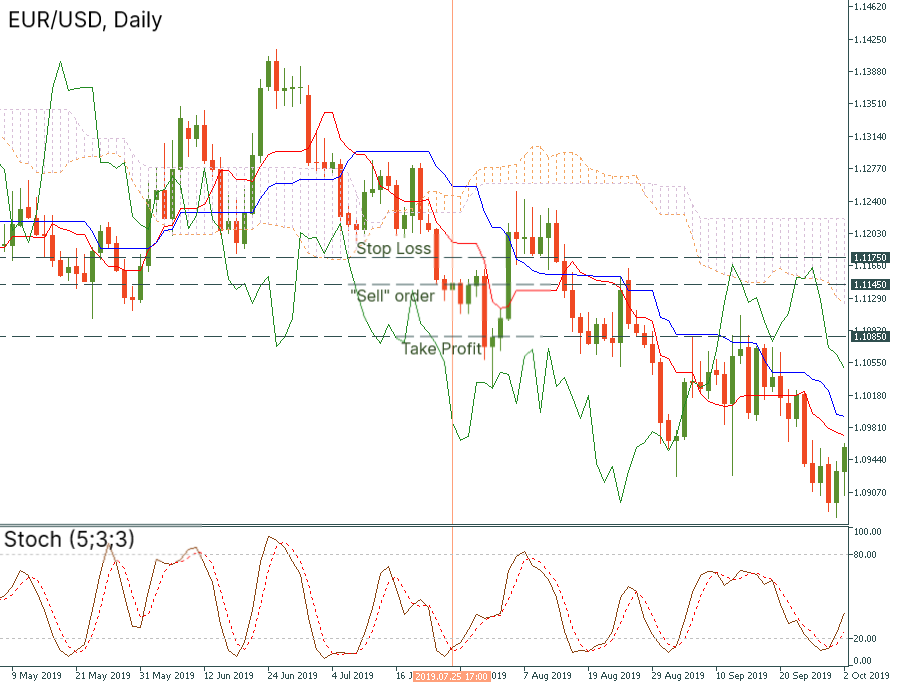
Example: On the same daily chart of EUR/USD, the price was moving below the blue line of Ichimoku and the cloud. On July 25, the stochastic oscillator crossed in the oversold zone. We placed a sell order at the opening price of the next candlestick. This is the 1.1145 level. We locate the Stop Loss at 1.1175 (30 pips above the entry), while Take Profit goes at 1.1085 (60 pips below the entry).
As we can see, with the strategy above the Ichimoku indicator looks less horrifying for a novice trader. The lines can show you the right direction of a trend and, in fact, “predict” further momentum.

Bill Williams is the creator of some of the most popular market indicators: Awesome Oscillator, Fractals, Alligator, and Gator.

Trend strategies are good - they may give significantly good results in any time frame and with any assets. The main idea of the ADX Trend-Based strategy is to try to catch the beginning of the trend.

Counter-trend strategies are always the most dangerous but also the most profitable. We are pleased to present an excellent counter-trend strategy for working in any market and with any assets.


Your request is accepted.
We will call you at the time interval that you chose
Next callback request for this phone number will be available in 00:30:00
If you have an urgent issue please contact us via
Live chat
Internal error. Please try again later