


Williams’ Strategy
Bill Williams is the creator of some of the most popular market indicators: Awesome Oscillator, Fractals, Alligator, and Gator.

Don’t waste your time – keep track of how NFP affects the US dollar!
Data Collection Notice
We maintain a record of your data to run this website. By clicking the button, you agree to our Privacy Policy.

Beginner Forex Book
Your ultimate guide through the world of trading.

Check Your Inbox!
In our email, you will find the Forex 101 book. Just tap the button to get it!
Risk warning: CFDs are complex instruments and come with a high risk of losing money rapidly due to leverage.
66.43% of retail investor accounts lose money when trading CFDs with this provider.
You should consider whether you understand how CFDs work and whether you can afford to take the high risk of losing your money.
Warning! Old version of the browser!
Press one of the icons below to proceed to the official website of the developer and download the latest version of your browser.

Online Forex broker
2022-08-24 • Updated
Information is not investment advice
Most traders prefer to trade using technical indicators like RSI and MACD. Others love using a bare chart to make their decisions. No doubt, support and resistance lines are a vital part of a trader’s routine. We want to broaden your trading potential, and thus we introduce you to the guide to supply and demand zones in forex trading. From the manual, you’ll learn how to identify and use the zones in your favor.
The supply and demand concept came from the economic theory. Supply means the number of goods available to users, while demand is the need for the goods. The more supply we have on the market, the easier it’s for the asset price to fall. On the contrary, high demand usually boosts prices due to customers’ urge to buy an item.
In trading, people use supply and demand as a resistance and support areas where the price of an asset may slow down or reverse. They’re similar to resistance and support lines at first glance. However, there are fundamental reasons for supply and demand zones to occur.
Supply and demand trading is about placing your orders according to zones where the price tends to reverse due to various factors. Summed up with other trading techniques, supply and demand trading provides a comprehensive and powerful tool that can take your results to a new level.
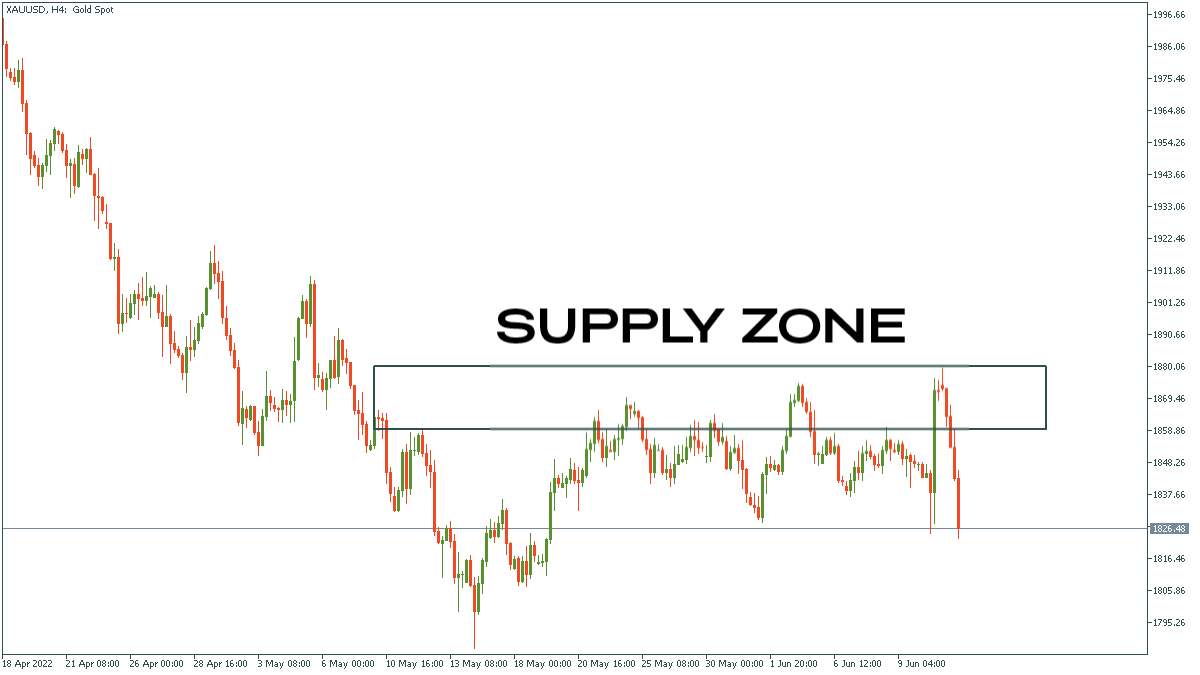
A supply zone is where traders and investors try to sell an asset for fundamental and technical reasons. Some market participants are selling because the asset reached their target. Others do the same due to changing economic environment or news that has altered an asset’s outlook. Usually, the price reacts sharply to the supply zone, meaning that there is a lot of selling interest.
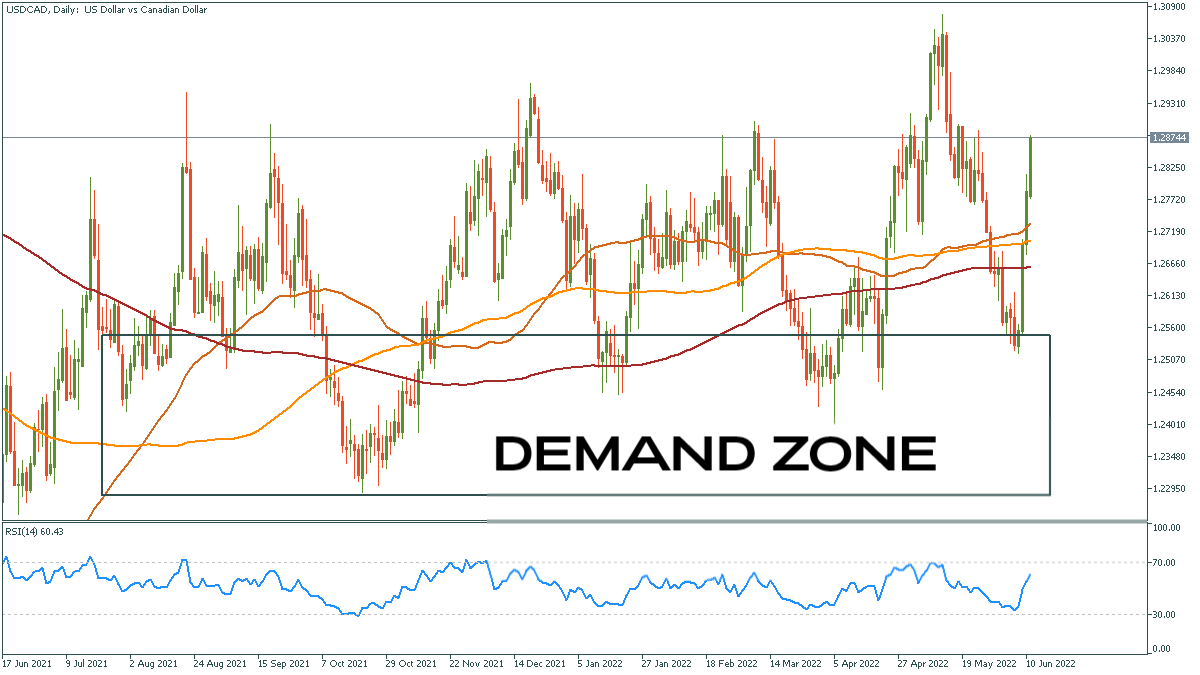
The same goes for demand zones. A demand zone is a price area with strong buying interest below the current price action. Many investors don’t want to buy the asset until it goes lower and reaches the demand zone because a person may get greater returns on the portfolio. Looking at the chart below, we can see a lot of buying interest in the demand zone, most likely caused by a large volume of buy orders resting at this level.
The most important thing you need to know is that supply and demand zones are an area of interest for various traders. Further, we’ll discuss stages of trading with supply and demand zones. You’ll find it both comprehensive and straightforward to get into.
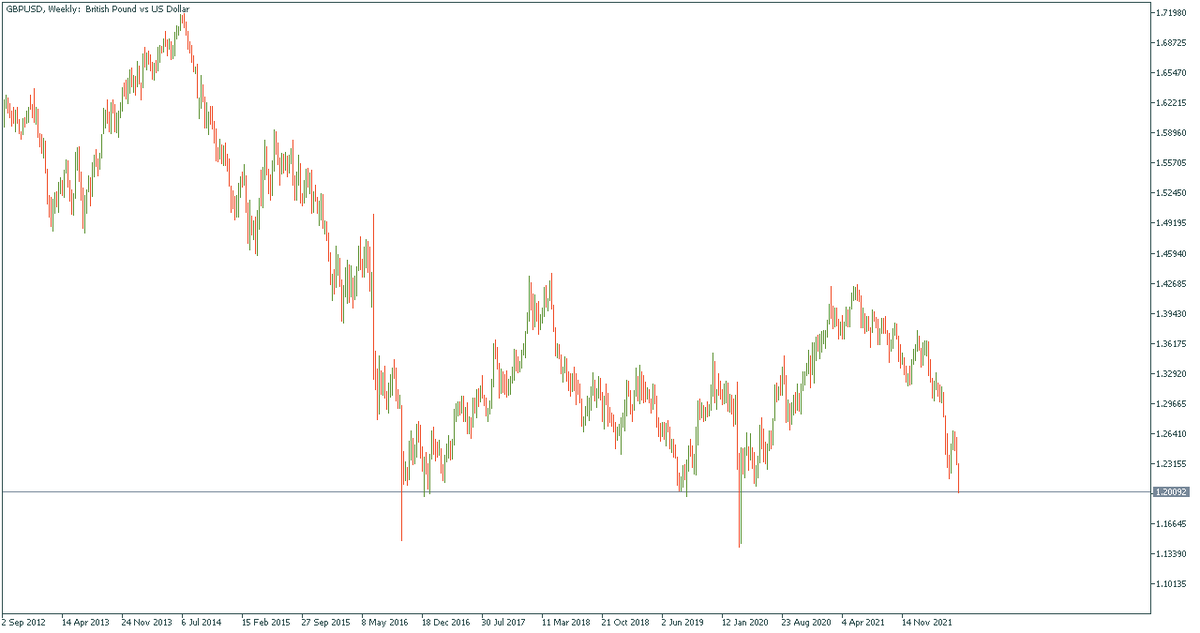
To plan your trading correctly, you need to set an entry point, stop loss and take profit orders. At first, you need to check charts and find an asset that looks somewhat like that:
Next, we need to set the demand zone for the asset. Define the upper and lower borders of the demand zone by putting the support lines in the lower part of the chart. As a result, we’ll get the demand zone for the asset.
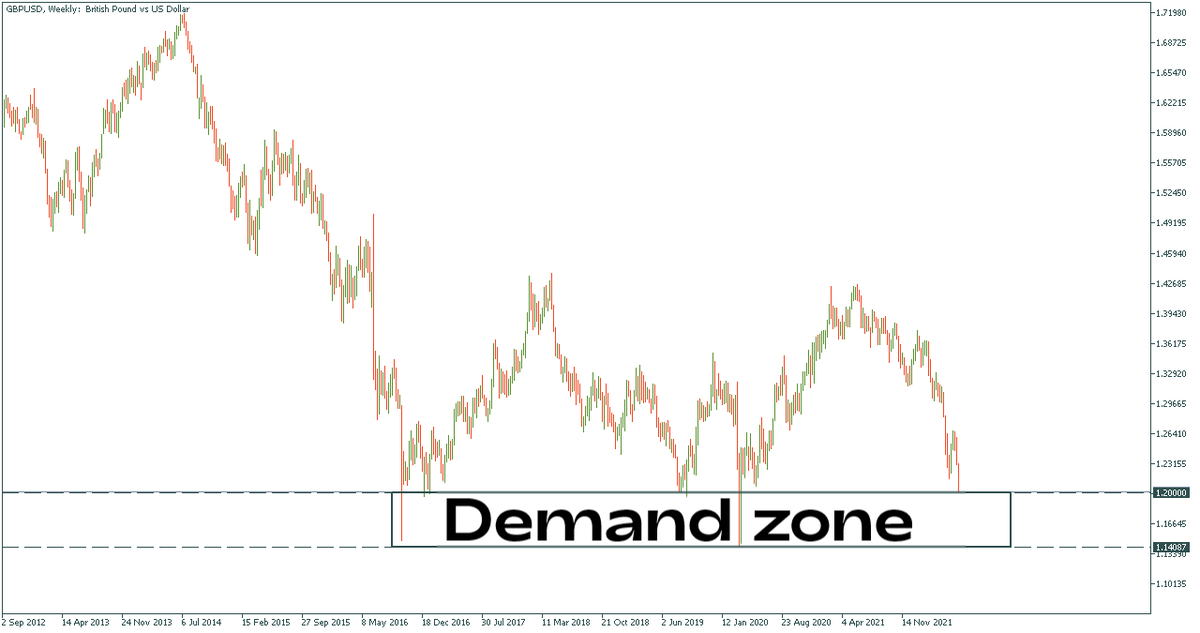
Then, we should define an entry point for the trade. We’ll talk more about various trading strategies later in this guide but for now, let’s say we are trading the most common supply and demand trading strategy, which is range trading. Thus, we will look for long entries somewhere in the demand zone. For the asset above (GBPUSD), the entry should be between 1.1408 and 1.2000.
It’s crucial for supply and demand trading to understand that when the asset goes lower, the chances for it to reverse are higher becauseris more investors and traders find the instrument valuable and oversold.
The most typical supply and demand trading strategy is range trading. The rules are simple: you find an asset with a strong supply or demand zone and enter on the bounce. Recent moves in the EURUSD pair can act as an example.
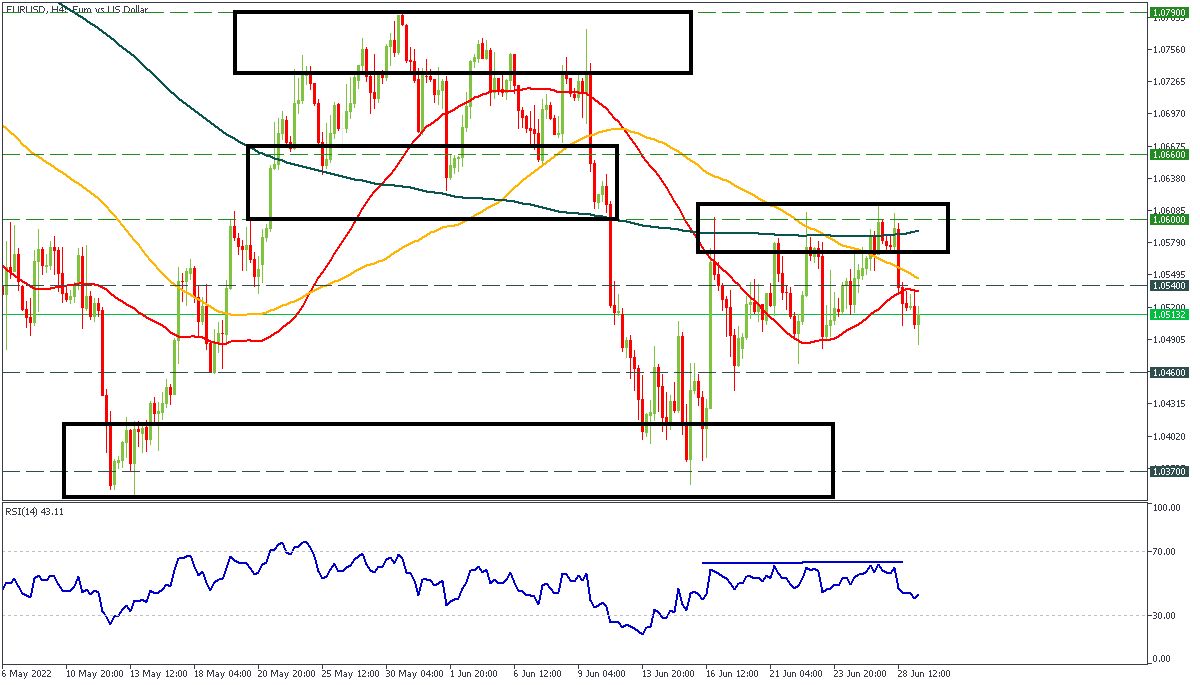
Every zone that causes the upside movement is a demand zone, and vice versa. The pair has been moving from the supply to a demand zone. Thus, the trading strategy is based on waiting for the price to enter the area and opening orders in the opposite direction.
The rules are pretty similar to the support and resistance trading, but demand and supply zones are usually wider. In the case of the figure above, it would have been wise to open short trades near the 1.0790 zone and long trades below the 1.0660 line. Notice that if the price breaks through the demand zone, it can quickly become the supply.
Just as always, supply and demand zones are not forever. At some moment, the sentiment changes, the market starts to price in new data, and the alignment of forces shifts from bulls to bears and vice versa. Thus, you should know how to use a breakout strategy when trading supply and demand zones. Here’s an example:
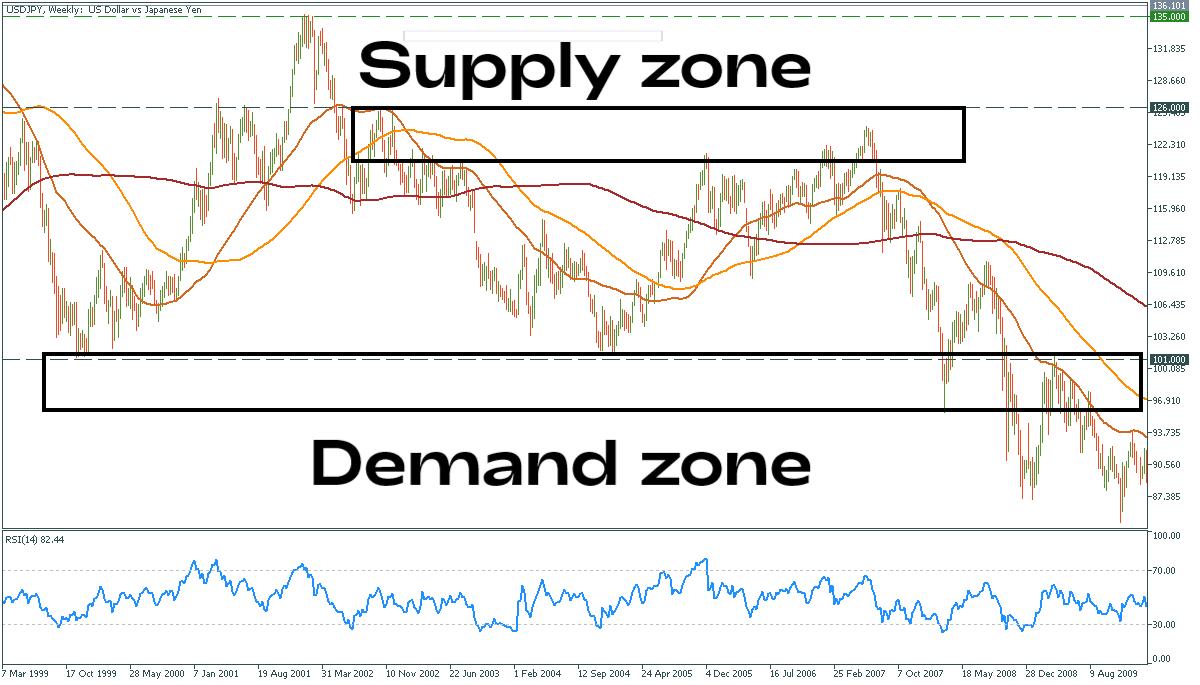
On the chart above, the yen touched the demand zone four times. After the sentiment changed, the demand zone lost its power and turned into the supply zone. That’s why the USDJPY plunged below the area and made a retest before the further decline. Notice the increased volatility following the breakout. It may help us spot the difference between a true and a fake breakout.
The breakout strategy is a logical continuation of the range trading due to the inevitable nature of markets that move from one consolidation to another. Thus, the more touches of a supply or demand zone you see, the greater the chances of a breakout. As we mentioned earlier, please pay attention to volatile movements because they mean the process of revaluating has begun.
Demand and supply zones are very similar to support and resistance; therefore, these areas indicate where a trader can place stops and limits.
These areas allow traders to implement a favorable risk-to-reward approach in trades. Range traders that are selling at the supply zone can set stops above the supply zone and targets at the demand zone. Conservative traders can set the target above the demand zone or implement some other risk management techniques.
Supply and demand trading usually refers to identifying the zones in which the reaction is unusually strong. You can trade on smaller timeframes, but noisy and somewhat chaotic movements are highly likely. Big players like institutional traders, banks, and investors, use bigger timeframes to eliminate unnecessary volatility. Thus, it would be better for you to do the same and go for less risky trades. Play big!
Continuously monitor the market sentiment and try to predict the possible reaction when the price enters a supply or demand zone. Volatile and sharp movement in the zone’s direction usually signals potential breakout. Thus, the asset may continue its movement in the same direction.
Indicators like RSI and MACD are extremely helpful when identifying supply and demand zones. They can provide you with insights on a possible continuation or a reversal. If the price moves in the supply zone and the RSI oscillator is not in the overbought zone, then there is a high chance of further rise of the asset. On the contrary, high numbers on the RSI chart in tandem with price reaching the supply area signal a possible reversal.

Bill Williams is the creator of some of the most popular market indicators: Awesome Oscillator, Fractals, Alligator, and Gator.

Trend strategies are good - they may give significantly good results in any time frame and with any assets. The main idea of the ADX Trend-Based strategy is to try to catch the beginning of the trend.

Counter-trend strategies are always the most dangerous but also the most profitable. We are pleased to present an excellent counter-trend strategy for working in any market and with any assets.


Your request is accepted.
We will call you at the time interval that you chose
Next callback request for this phone number will be available in 00:30:00
If you have an urgent issue please contact us via
Live chat
Internal error. Please try again later