


Williams’ Strategy
Bill Williams is the creator of some of the most popular market indicators: Awesome Oscillator, Fractals, Alligator, and Gator.

Don’t waste your time – keep track of how NFP affects the US dollar!
Data Collection Notice
We maintain a record of your data to run this website. By clicking the button, you agree to our Privacy Policy.

Beginner Forex Book
Your ultimate guide through the world of trading.

Check Your Inbox!
In our email, you will find the Forex 101 book. Just tap the button to get it!
Risk warning: ᏟᖴᎠs are complex instruments and come with a high risk of losing money rapidly due to leverage.
70.72% of retail investor accounts lose money when trading ᏟᖴᎠs with this provider.
You should consider whether you understand how ᏟᖴᎠs work and whether you can afford to take the high risk of losing your money.
Warning! Old version of the browser!
Press one of the icons below to proceed to the official website of the developer and download the latest version of your browser.

Online Forex broker
2022-09-23 • Updated
Information is not investment advice
The relative strength index (RSI) is an indicator used in technical analysis to measure the momentum of recent price changes. It helps traders to see whether a stock, a currency pair, or other asset is overbought or oversold. The RSI is presented as an oscillator (a line chart that moves between two extremes) and can have a reading from 0 to 100.
The standard is to use 14 periods to calculate the initial RSI value. The RSI will rise as the number and size of positive closes increase, and it will fall as the number and size of negative closes increase.
Generally, when the RSI crosses the horizontal 30 reference level from below, it is a bullish sign, and when it slides below the horizontal 70 reference level, it is a bearish sign. Put another way, one can interpret that RSI values of 70 or above indicate an asset is overbought or overvalued and may be primed for a trend reversal or corrective price pullback. An RSI of 30 or below indicates an oversold or undervalued condition.
During trends, the RSI may fall into a band or range. During an uptrend, the RSI tends to stay above 30 and should frequently hit 70. During a downtrend, it is rare to see the RSI exceed 70, and the indicator frequently hits 30 or below. These guidelines can help determine trend strength and spot potential reversals. For example, if the RSI can’t reach 70 on several consecutive price swings during an uptrend, but then drops below 30, the trend has weakened and could be reversing down.
On the contrary, if the downtrend is unable to reach 30 or below and then rallies above 70 it means that the downtrend has weakened and could be reversing to the upside. Trend lines and moving averages can also help with the analysis.
The RSI is a multifunctional indicator. It presents not the only price over/undervaluation but can provide traders with many signals, such as divergence and patterns.
Let’s dive into an example and figure out what is the best way to use this oscillator.
Divergence
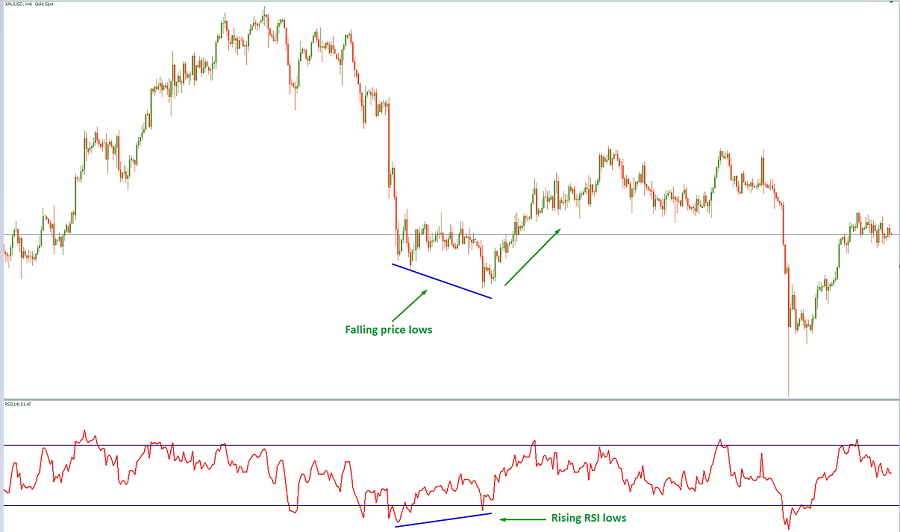
A bullish RSI divergence occurs when the indicator forms higher lows, but, at the same time, the price shows lower minimums. This indicates rising bullish momentum. A break above oversold territory can be used to trigger a long new position.
A bearish RSI divergence occurs when the indicator forms lower highs, but, at the same time, the price shows higher maximums.
The moment when the first green bar appears and the divergence is confirmed, a trader may open a trade with a Stop Loss under a recent low.
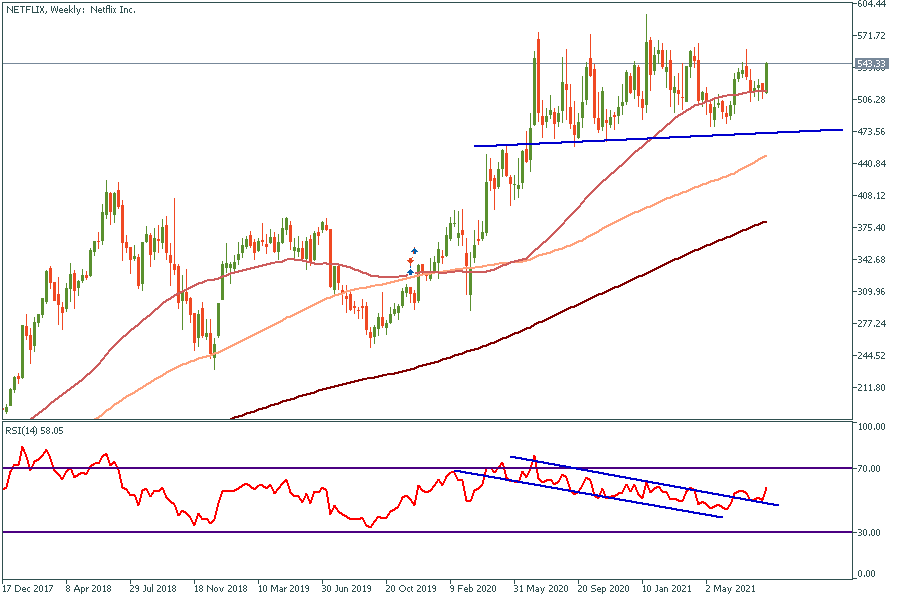
Swing Rejections
Another trading technique examines the RSI’s behavior when it is reemerging from overbought or oversold territory. The typical swing rejection consists of 4 parts.
The moment of breakout is the trader’s entry point. Stop-loss sets under the recent low.
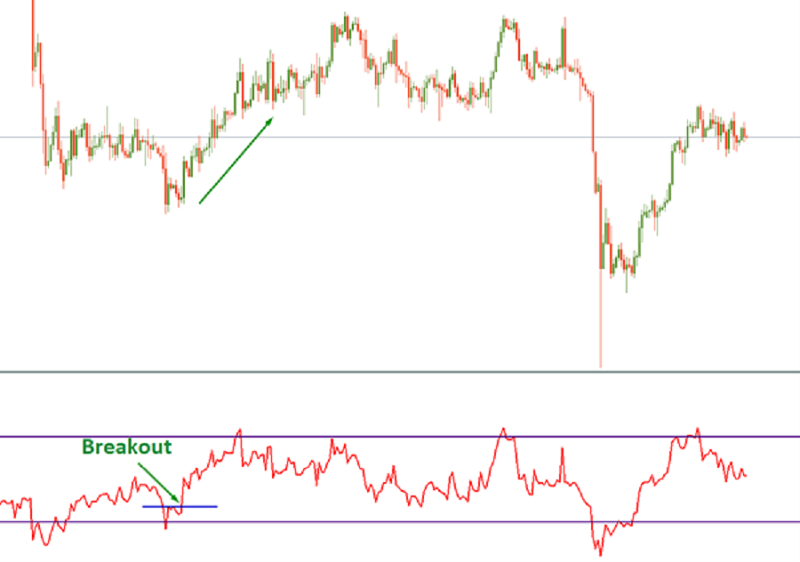
Accumulation
When a price is staying in the range and RSI moves inside a channel, it means that investors (traders) accumulate powers for the next move. Usually, during these moments, the RSI gets into the 40-60 range and after that, a channel gets broken and massive movements begin.
Patterns
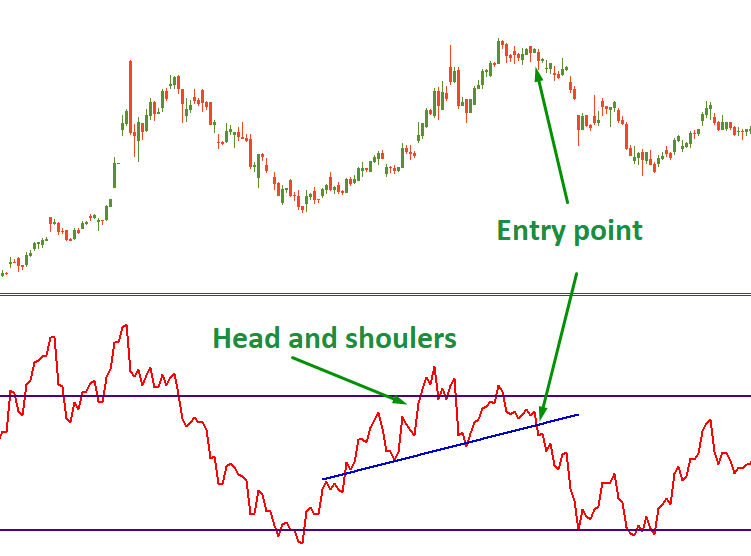
Another great thing about RSI is that patterns work as usual. On the chart above traders couldn’t notice the trend reversal according to the price action, but the “Head with Shoulders” pattern appeared on the RSI. As soon as the RSI line crossed the shoulder line the price went down.
Conclusion

Bill Williams is the creator of some of the most popular market indicators: Awesome Oscillator, Fractals, Alligator, and Gator.

Trend strategies are good - they may give significantly good results in any time frame and with any assets. The main idea of the ADX Trend-Based strategy is to try to catch the beginning of the trend.

Counter-trend strategies are always the most dangerous but also the most profitable. We are pleased to present an excellent counter-trend strategy for working in any market and with any assets.


Your request is accepted.
We will call you at the time interval that you chose
Next callback request for this phone number will be available in 00:30:00
If you have an urgent issue please contact us via
Live chat
Internal error. Please try again later