


Williams’ Strategy
Bill Williams is the creator of some of the most popular market indicators: Awesome Oscillator, Fractals, Alligator, and Gator.

Don’t waste your time – keep track of how NFP affects the US dollar!
Data Collection Notice
We maintain a record of your data to run this website. By clicking the button, you agree to our Privacy Policy.

Beginner Forex Book
Your ultimate guide through the world of trading.

Check Your Inbox!
In our email, you will find the Forex 101 book. Just tap the button to get it!
Risk warning: CFDs are complex instruments and come with a high risk of losing money rapidly due to leverage.
66.43% of retail investor accounts lose money when trading CFDs with this provider.
You should consider whether you understand how CFDs work and whether you can afford to take the high risk of losing your money.
Warning! Old version of the browser!
Press one of the icons below to proceed to the official website of the developer and download the latest version of your browser.

Online Forex broker
2022-08-26 • Updated
Information is not investment advice
Position trading is a type of trading that suits for super-patient, witty and long-sighted traders, who have a real feel for the markets. Their primary goal is to benefit from the dominant trends rather than from short-term market fluctuations. Typically, they use fundamental analysis for their trades, but sometimes they need to refer to technical tools as well. And one more key characteristic that defines position traders – they have sizable accounts to trade with.
In the following article, we are going to explore the strategies that encapsulate the two aspects of position trading mentioned above – swap and commodity correlations.
For example, we have decided to trade CAD/JPY currency pair.
Canada is one of the world’s largest oil-producing nations; it is a well-known exporter of this commodity. So, the Canadian dollar normally rises when oil prices go up. In contrast, Japan is considered to be a net oil importer. This causes the yen to weaken when oil prices gain. This situation makes oil prices dynamic a leading indicator for the movement of CAD/JPY currency pair.
Strategy concept:
Timeframe – daily
Long trade’s setup:
Example:
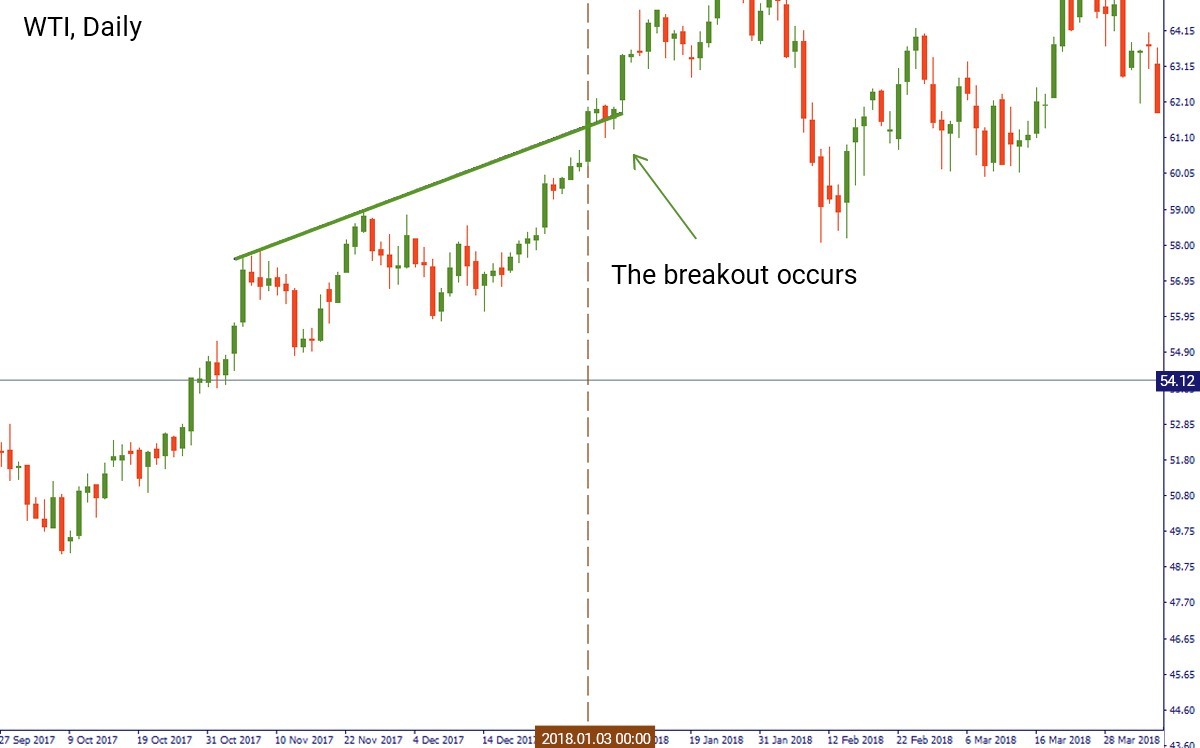
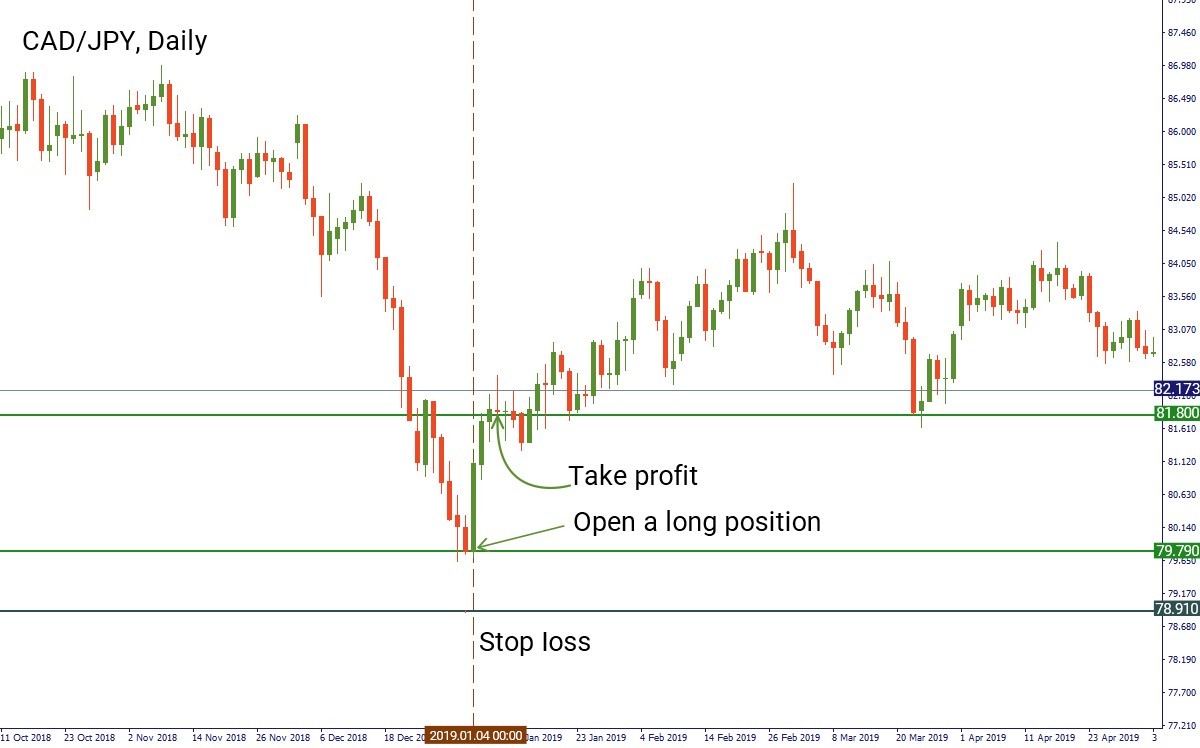
On the daily chart of WTI, we identified an uptrend and were looking for a breakout of it. The candlestick which closed above the trend line occurred on January 3. After that, on January 4, we opened a long position for CAD/JPY at the opening price of a candlestick at 79.79. We placed a stop loss at the previous support level at 78.91 and take profit at 81.8.
Short trade’s setup
Example:
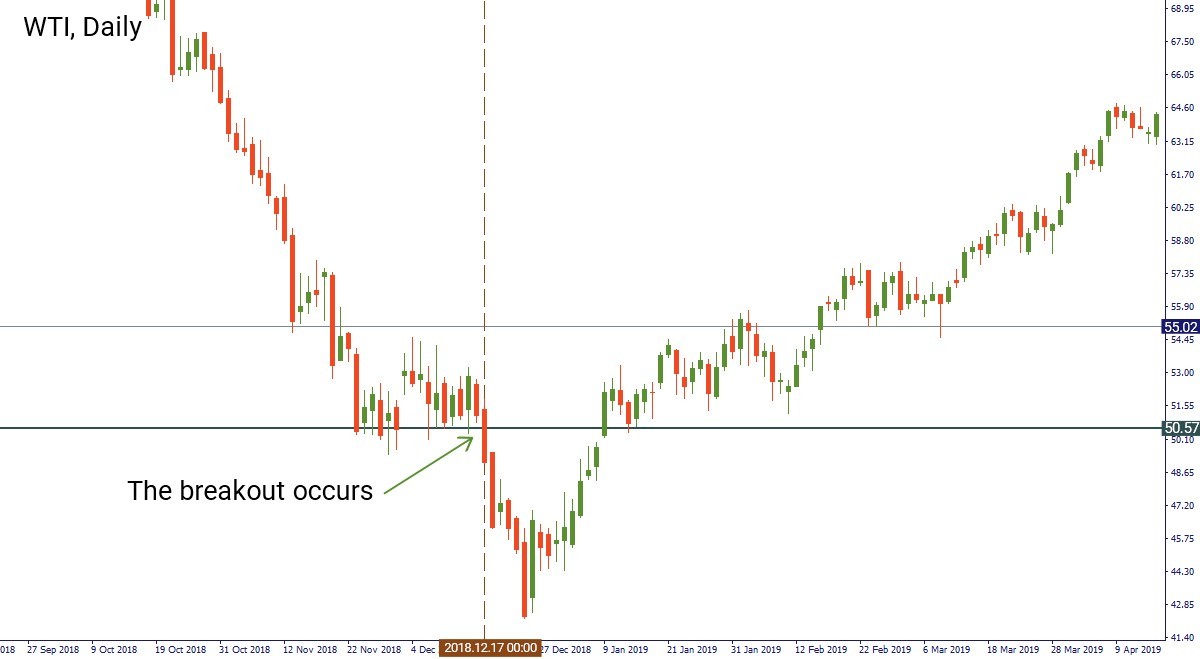
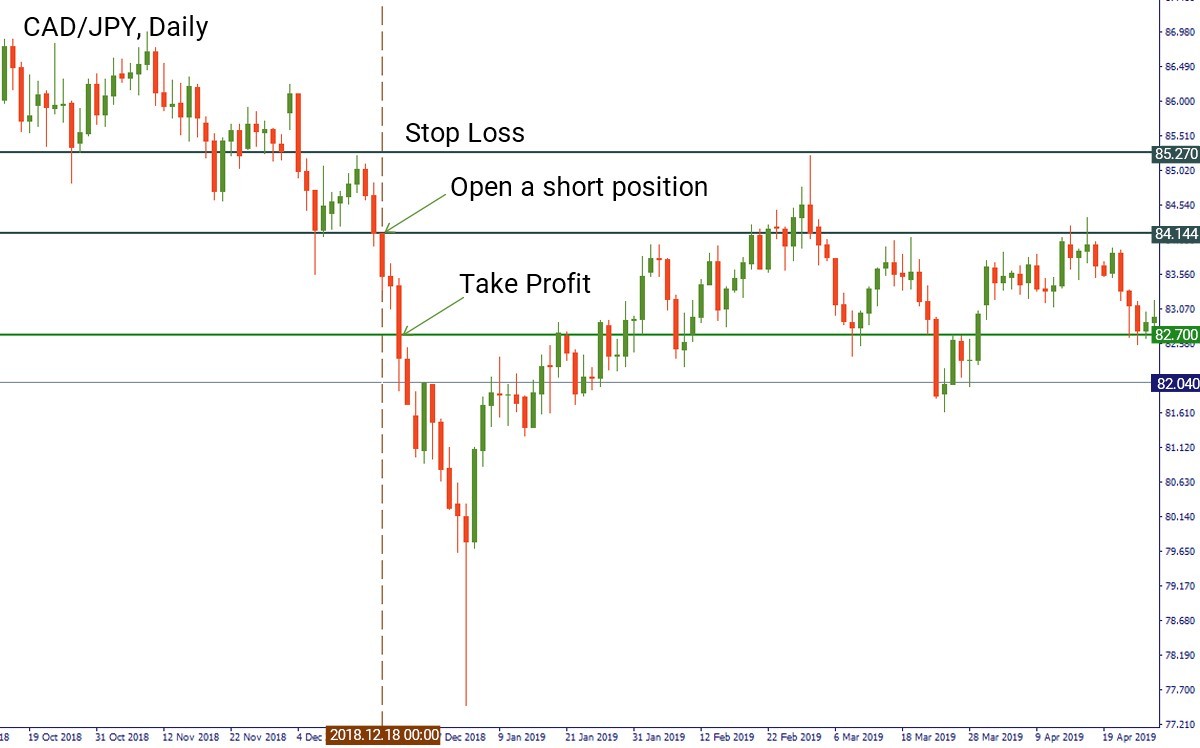
On the daily chart of WTI the price of crude has been consolidating above the support level at $50.57. We waited for a breakout of this level, which happened on December 17. After that, we switched to the chart of CAD/JPY. We placed a short order at the opening price of the candlestick on December 18 at $84.14. The stop loss for this position will be situated at $85.27, while the take profit goes at $82.7.
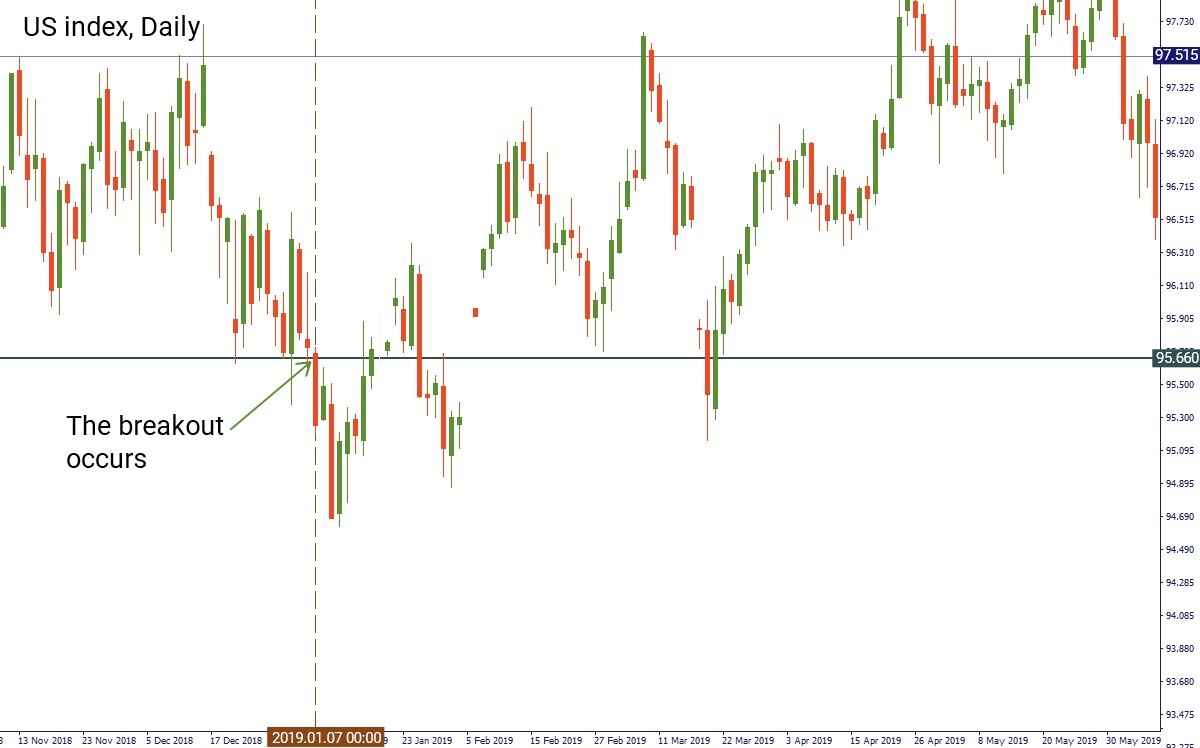
The strategy that we are going to describe here explains the negative correlation between the US dollar index (the index measuring the value of the USD relative to the value of a basket of major currencies) and the price of gold. As a rule, the US dollar index falls, when gold rises.
Strategy concept:
Timeframe – daily
Long trade’s setup:
Example:
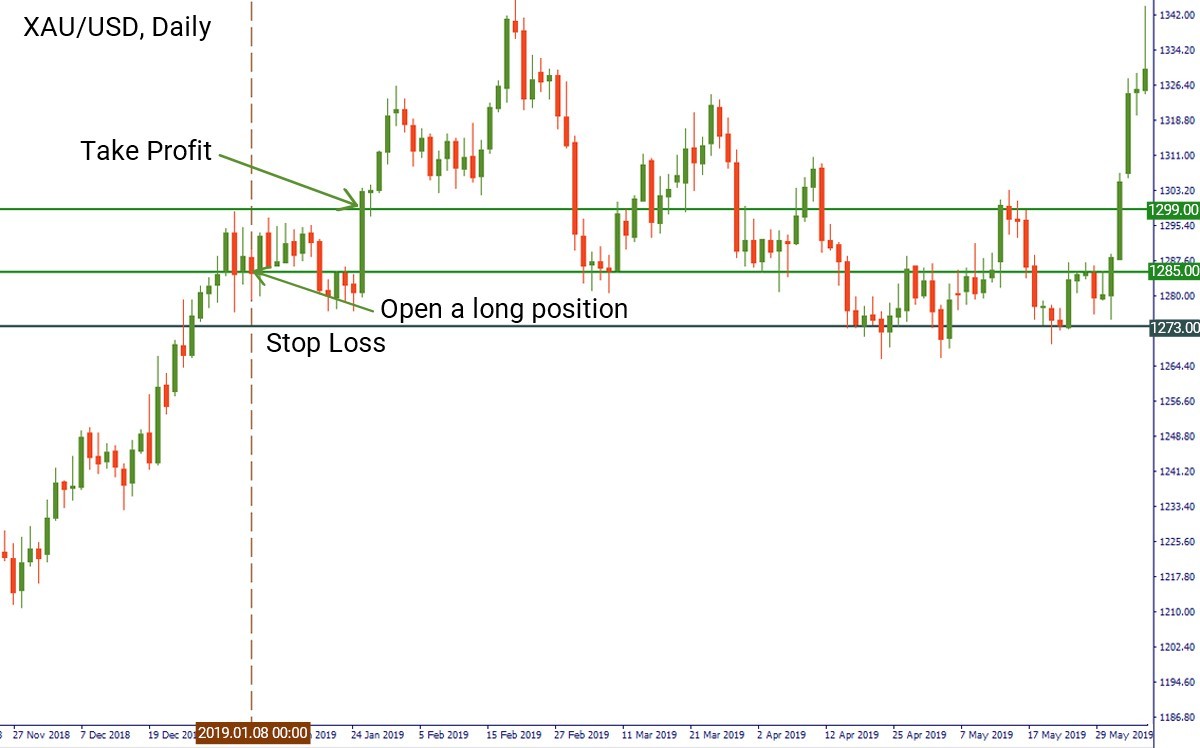
On the daily chart of the US dollar index, we noticed the breakout of the 95.66 support on January 7. After that, we opened the chart of gold and entered a long position at $1,285 on January 8. We placed the stop loss at the previous support level at $1,273. The take profit level will lie at $1,299 (a little bit below the resistance level).
Short trade’s setup:
Example:
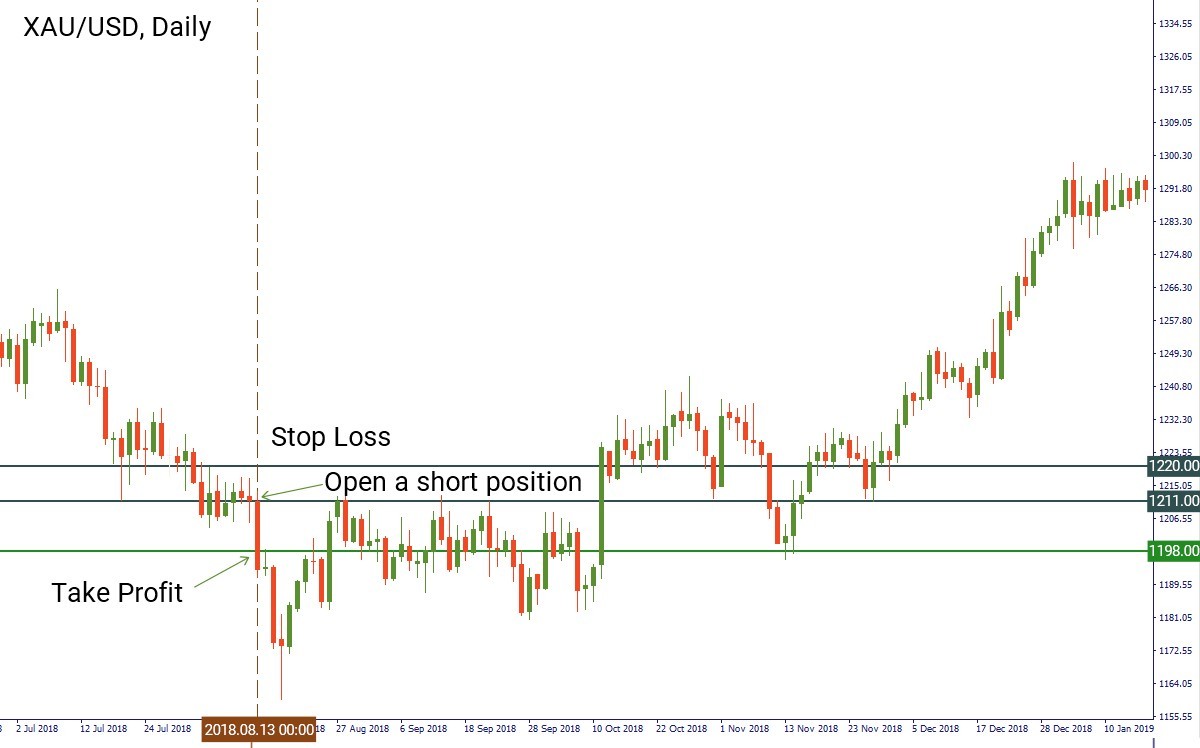
The situation when you need to open a short position is similar to the scenario with a long one. On August 10 (Friday), we identified a breakout of the resistance on the daily chart of the US dollar index. We switched to the chart of XAU/USD and entered a short position at the opening price of the candlestick on August 13 (Monday) at $1,211. We put the stop loss above the first resistance level before entry at $1,220. The level of take profit will lie at $1,198 (close to the support level).

Understanding correlations and fundamental analysis makes it easier for a position trader to catch the market’s movement and open a position at the right moment.
Source: The strategies retrieved from the book of "17 Proven Currency Trading Strategies" by Mario Sant Singh.

Bill Williams is the creator of some of the most popular market indicators: Awesome Oscillator, Fractals, Alligator, and Gator.

Trend strategies are good - they may give significantly good results in any time frame and with any assets. The main idea of the ADX Trend-Based strategy is to try to catch the beginning of the trend.

Counter-trend strategies are always the most dangerous but also the most profitable. We are pleased to present an excellent counter-trend strategy for working in any market and with any assets.


Your request is accepted.
We will call you at the time interval that you chose
Next callback request for this phone number will be available in 00:30:00
If you have an urgent issue please contact us via
Live chat
Internal error. Please try again later