Bill Williams is the creator of some of the most popular market indicators: Awesome Oscillator, Fractals, Alligator, and Gator.

Don’t waste your time – keep track of how NFP affects the US dollar!
Data Collection Notice
We maintain a record of your data to run this website. By clicking the button, you agree to our Privacy Policy.

Beginner Forex Book
Your ultimate guide through the world of trading.
Check Your Inbox!
In our email, you will find the Forex 101 book. Just tap the button to get it!
Risk warning: ᏟᖴᎠs are complex instruments and come with a high risk of losing money rapidly due to leverage.
68.53% of retail investor accounts lose money when trading ᏟᖴᎠs with this provider.
You should consider whether you understand how ᏟᖴᎠs work and whether you can afford to take the high risk of losing your money.
2024-03-26 • Updated
Information is not investment advice
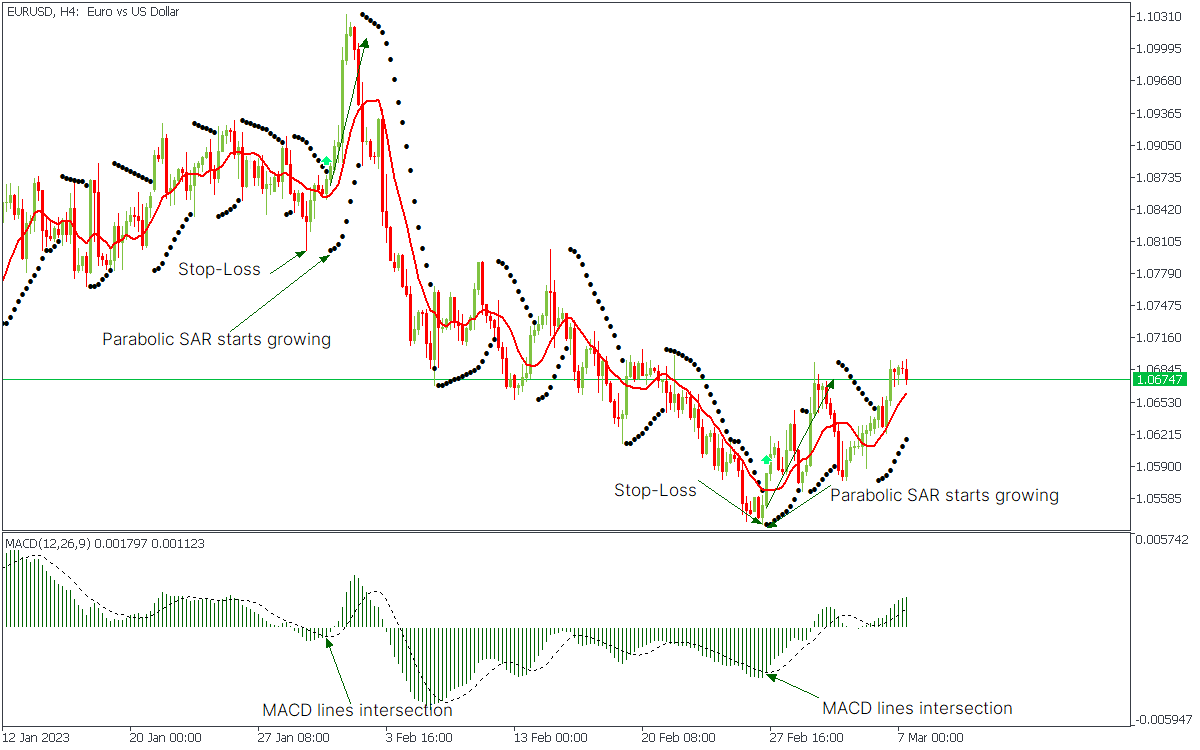
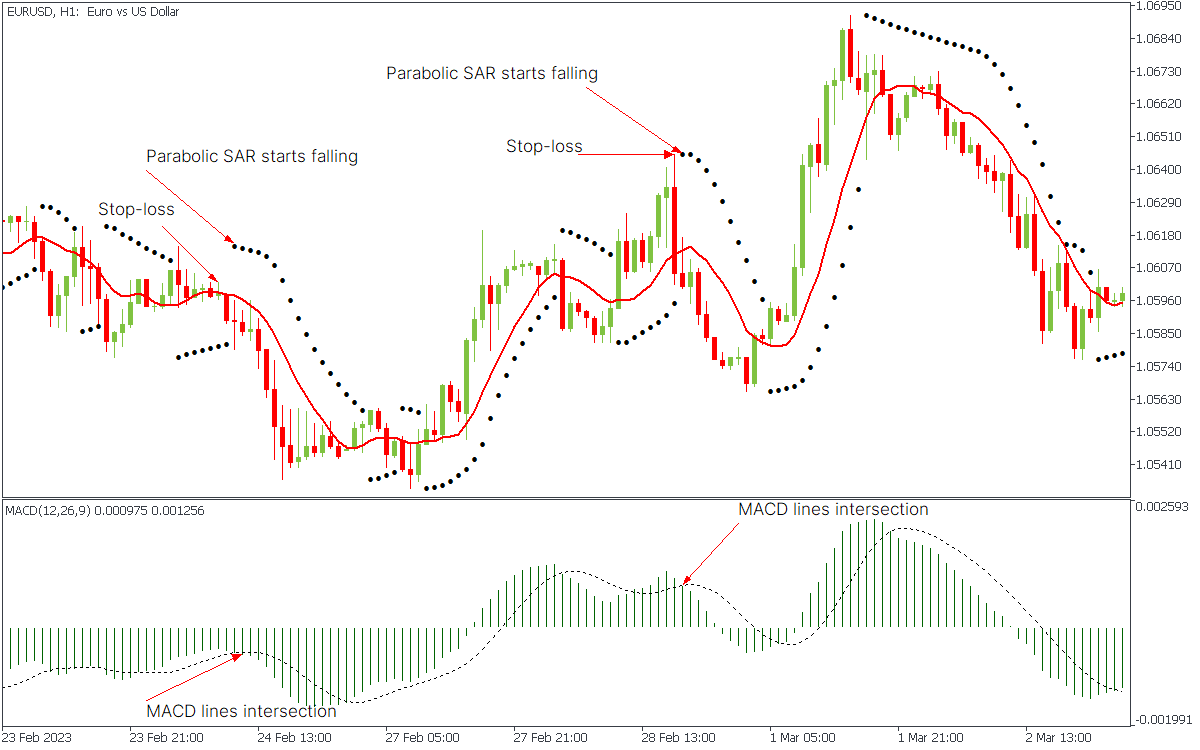
As we know, strong trend movements are important on the market. We present you a trending strategy that will allow you to identify the very beginning of a solid incipient trend and open a deal.
Instruments: any
Indicators: MACD (12,26,9), Parabolic SAR (0.02; 0.2) and SMA (period 10) with the default settings
Timeframe: >H1
Risk management rules: Fixed trade volume with 0.1 lot.
It is recommended to use a Stop Loss at the level of the nearest local minimum before receiving the signal.

It is recommended to use a Stop Loss at the level of the nearest local maximum before receiving the signal.

When searching for signals, it is important to pay attention to how the MACD lines are crossed. The sharper the crossing (the more substantial the "angle of attack"), the greater the chance of a successful signal. Typically, the angle of attack depends on how far the MACD lines deviate from each other before they cross.
The MACD+Parabolic indicators can be combined with other types of technical analysis. For example, with chart analysis and support/resistance levels. If the buy signal appears when the price tests support levels, the probability of a successful transaction increases. The same is true for the sell signal at resistance levels.
Legal disclaimer: The content of this material is a marketing communication, and not independent investment advice or research. The material is provided as general market information and/or market commentary. Nothing in this material is or should be considered to be legal, financial, investment or other advice on which reliance should be placed. No opinion included in the material constitutes a recommendation by Tradestone Ltd or the author that any particular investment security, transaction or investment strategy is suitable for any specific person. All information is indicative and subject to change without notice and may be out of date at any given time. Neither Tradestone Ltd nor the author of this material shall be responsible for any loss you may incur, either directly or indirectly, arising from any investment based on any information contained herein. You should always seek independent advice suitable to your needs.

Bill Williams is the creator of some of the most popular market indicators: Awesome Oscillator, Fractals, Alligator, and Gator.

Trend strategies are good - they may give significantly good results in any time frame and with any assets. The main idea of the ADX Trend-Based strategy is to try to catch the beginning of the trend.

Counter-trend strategies are always the most dangerous but also the most profitable. We are pleased to present an excellent counter-trend strategy for working in any market and with any assets.
Your request is accepted.
We will call you at the time interval that you chose
Next callback request for this phone number will be available in 00:30:00
If you have an urgent issue please contact us via
Live chat
Internal error. Please try again later