


Williams’ Strategy
Bill Williams is the creator of some of the most popular market indicators: Awesome Oscillator, Fractals, Alligator, and Gator.

Don’t waste your time – keep track of how NFP affects the US dollar!
Data Collection Notice
We maintain a record of your data to run this website. By clicking the button, you agree to our Privacy Policy.

Beginner Forex Book
Your ultimate guide through the world of trading.

Check Your Inbox!
In our email, you will find the Forex 101 book. Just tap the button to get it!
Risk warning: ᏟᖴᎠs are complex instruments and come with a high risk of losing money rapidly due to leverage.
70.72% of retail investor accounts lose money when trading ᏟᖴᎠs with this provider.
You should consider whether you understand how ᏟᖴᎠs work and whether you can afford to take the high risk of losing your money.
Warning! Old version of the browser!
Press one of the icons below to proceed to the official website of the developer and download the latest version of your browser.

Online Forex broker
2019-11-11 • Updated
Information is not investment advice
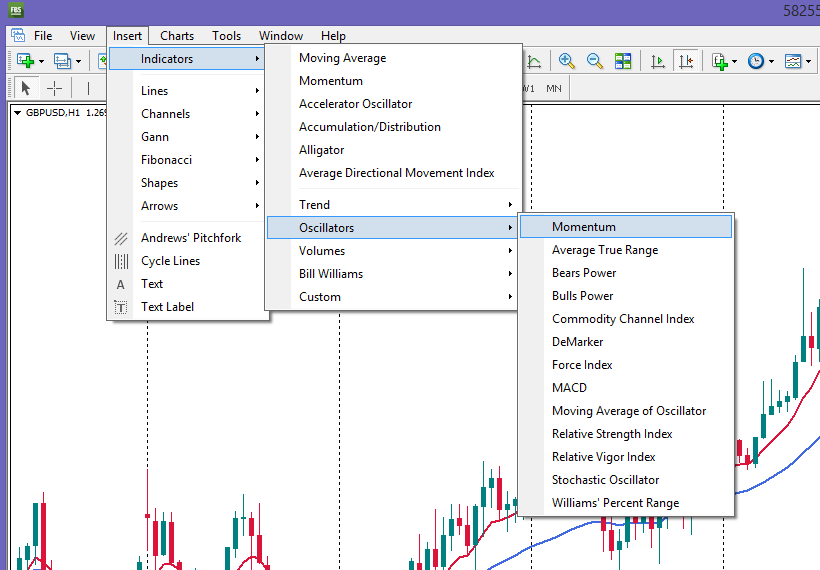
The momentum indicator is classified as an oscillator. It is designed to identify the strength of price movement; it helps traders to assess the extent of price fluctuations for a certain period as well as determine critical conditions that can be used for the position opening. The momentum indicator includes a single curve fluctuating within the borders of the additional window.
Any extreme deviation underlined by the technical tool can be used for the successful position opening. This constitutes a basis for our momentum strategy.
The momentum can be literally interpreted as the movement size. It is calculated as a ratio of the current market price to the price which was fixed a certain number of periods ago. The following method of calculation supposes the central line of the oscillator is located at the level of 100. The larger the parameter of the indicator (the period), the more slowly the line fluctuates, the less responding to various price changes it becomes.
The emergence of the extreme values on the chart consisting of 100 and more candles is a signal that current tendency will proceed. Nevertheless, before opening any positions, you need to find confirmation from other indicators.
The following tactics of trading with Momentum indicator is based on signals the trader receives when the line crosses 0 – 100 levels.
To determine the most relevant pivotal moment, it is recommended to construct fast moving average with periods of 5 – 10 candles. The signal for purchase occurs when moving average crosses the level of 100 from below up. The signal for sale occurs when the moving average crosses 100-line from top to down.
The momentum indicator is normally used in case of a breakout of trading channels. If there is a high (positive) momentum and the current price is higher than the previous one and the ascending trend is about to appear than it is a right time to buy. The selling condition would be the following: there should be a low (negative) momentum and the current price must be falling (there should be a bearish trend).
The main drawback of the momentum indicator – an immediate reaction of the indicator at the moment of false breakouts – prices bounces occurring in a result of speculative trades.
To avoid the false signals the momentum indicator might send, you should use other indicators for confirmation.
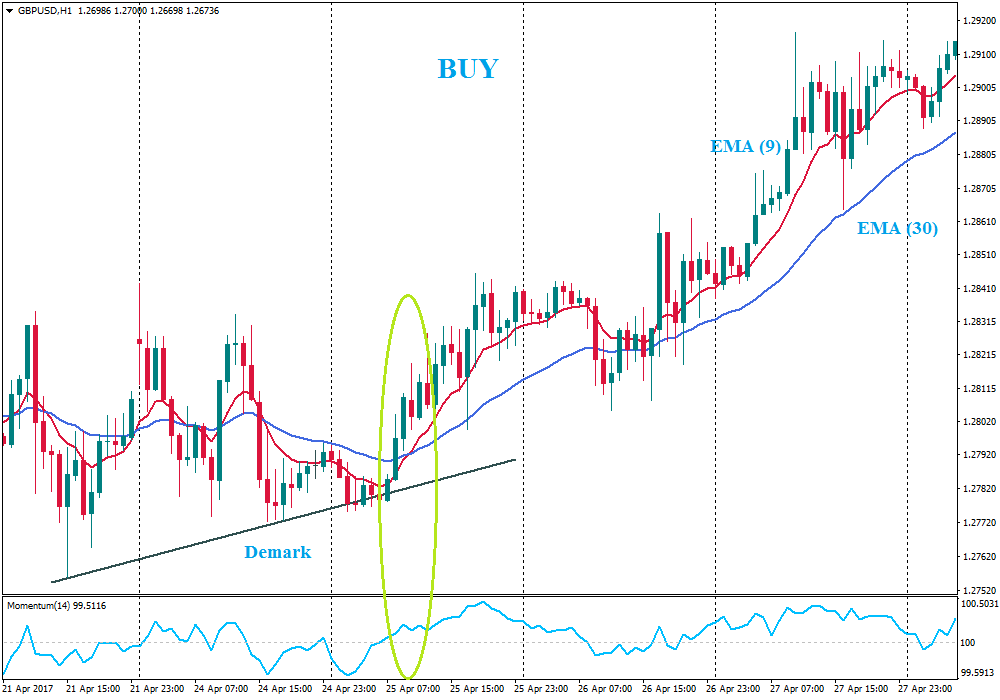
2 moving average – 9-period EMA (red line), 30-period EMA (blue line).
Momentum indicator (14) with 100 line
Timeframe: H1 – for determining the points of entry and holding the position
Demark line connecting lows and highs of price fluctuations
Currency pairs: any pairs in the period of stable volatility (the most effective ones – GBP/USD, EUR/USD, AUD/USD)
The price should break Demark line up;
The momentum line should move above 100 line;
The EMA (9) should cross the EMA (30) from the bottom upwards.
Breakout of the Demark line down;
Momentum lime should move below the 100 line;
The EMA (9) should cross EMA (30) from up to down.
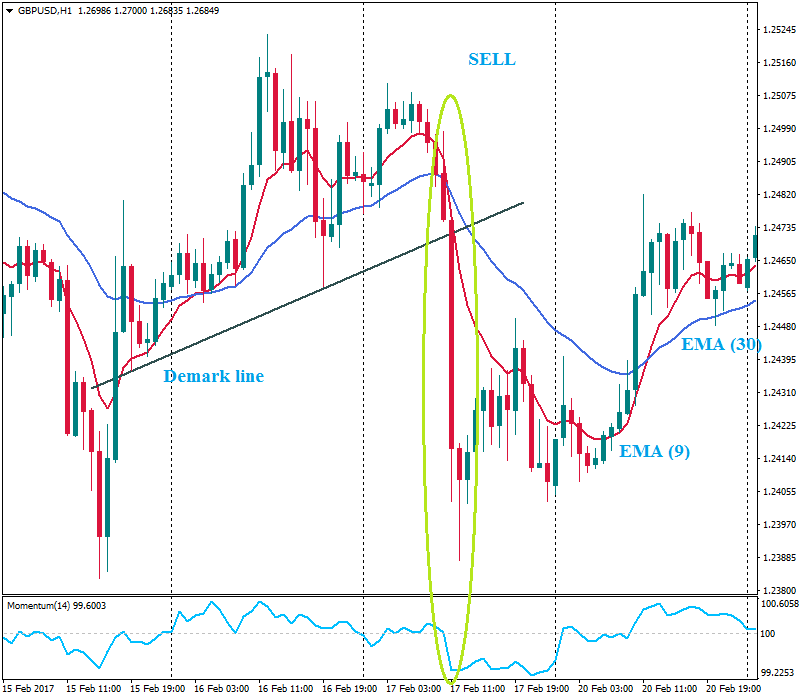
You should hit the button “open order” at the opening of a new candle. Place stop loss near the local high/low: sell signal – higher than the high you’ve identified; buy signal – lower than the near low. Close the transaction after momentum line crosses 100-line in the opposite direction.
Bill Williams is the creator of some of the most popular market indicators: Awesome Oscillator, Fractals, Alligator, and Gator.

Trend strategies are good - they may give significantly good results in any time frame and with any assets. The main idea of the ADX Trend-Based strategy is to try to catch the beginning of the trend.

Counter-trend strategies are always the most dangerous but also the most profitable. We are pleased to present an excellent counter-trend strategy for working in any market and with any assets.


Your request is accepted.
We will call you at the time interval that you chose
Next callback request for this phone number will be available in 00:30:00
If you have an urgent issue please contact us via
Live chat
Internal error. Please try again later