


Williams’ Strategy
Bill Williams is the creator of some of the most popular market indicators: Awesome Oscillator, Fractals, Alligator, and Gator.

Don’t waste your time – keep track of how NFP affects the US dollar!
Data Collection Notice
We maintain a record of your data to run this website. By clicking the button, you agree to our Privacy Policy.

Beginner Forex Book
Your ultimate guide through the world of trading.

Check Your Inbox!
In our email, you will find the Forex 101 book. Just tap the button to get it!
Risk warning: CFDs are complex instruments and come with a high risk of losing money rapidly due to leverage.
66.43% of retail investor accounts lose money when trading CFDs with this provider.
You should consider whether you understand how CFDs work and whether you can afford to take the high risk of losing your money.
Warning! Old version of the browser!
Press one of the icons below to proceed to the official website of the developer and download the latest version of your browser.

Online Forex broker
2020-03-25 • Updated
Information is not investment advice
There are a lot of strategies, which require the usage of Fibonacci levels. Traders try to adapt them in the best way so they can be used effectively in a combination with other technical tools. Today we are going to discuss a strategy, which is widely known among traders. It is called MacFibo.
Traders recommend implementing this strategy while trading the EUR/USD pair and gold on the H1 and H4 timeframes.
What do we need for the following strategy?
At first, we need to apply three moving averages to the chart.
Secondly, we adopt the Fibonacci levels to our trading strategy. You can do it in the settings:
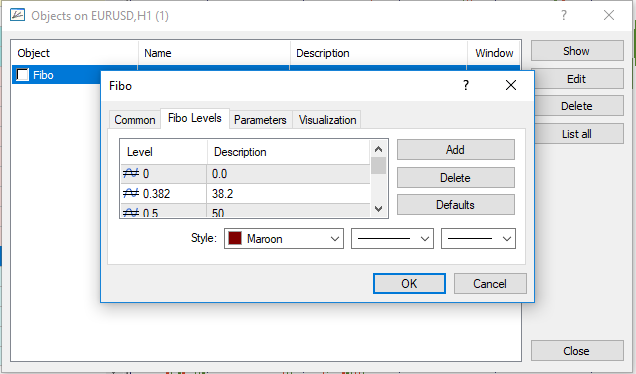
Here are the levels that we use:
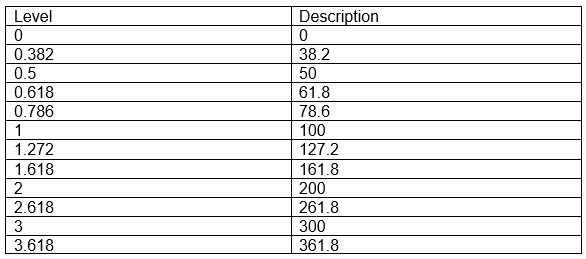
We need to implement the adapted Fibo levels following the special rules. Generally speaking, they depend on the direction of trading.
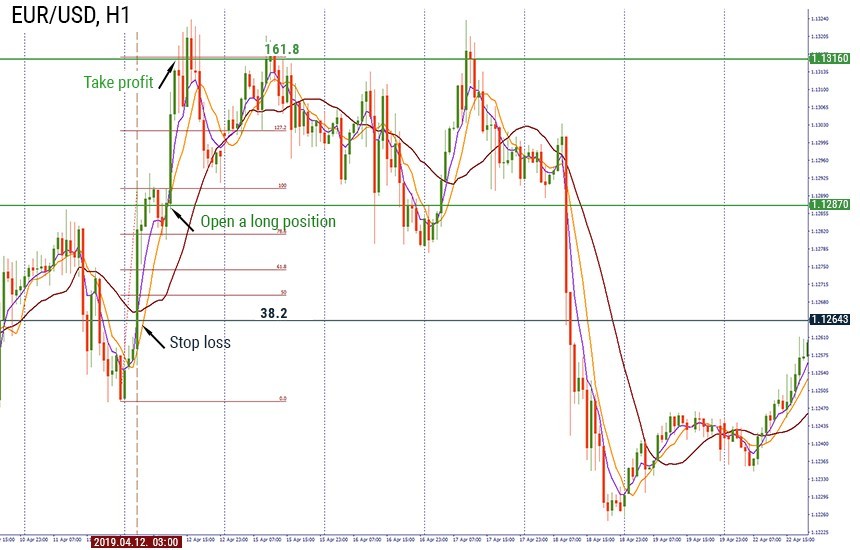
When should we buy?
Let’s consider the example on the H1 chart of EUR/USD. On April 12, the exponential moving average (violet) crossed the 20-period SMA (brown) from bottom to top. We opened a long position at 1.1287 after the price broke the previous resistance. We placed our stop loss at 1.1264 (38.2 Fibo level) and take profit at 1.1316 (161.8 Fibo level). As a result, we earned 29 pips.
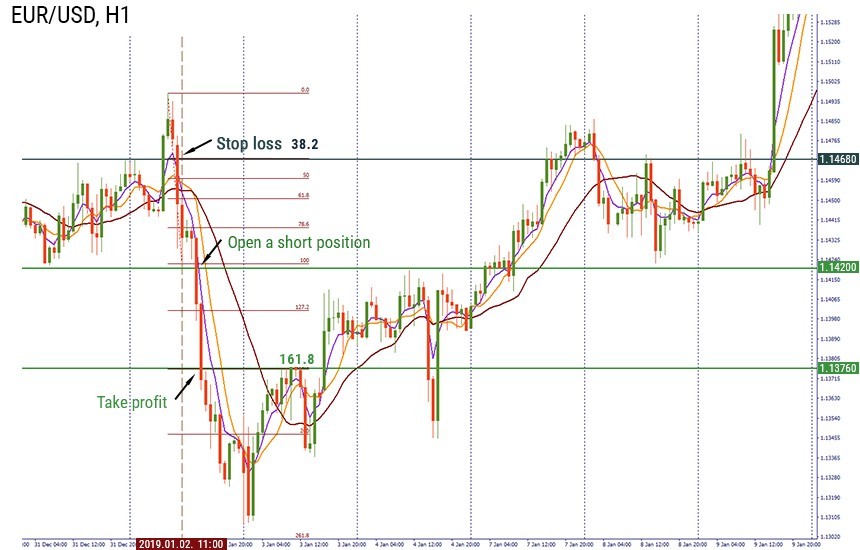
When should we sell?
On the H1 of EUR/USD, the 5-period EMA (violet) crossed the 20-period SMA (brown) upside down on January 2. We opened a short position at 1.1420 after the bearish candlestick occurred below the crossover below the support. We place our stop loss at 1.1438 (78.6 Fibo level). Our take profit level is placed at 1.1376 (161.8 Fibo level). We earned 44 pips.
This kind of strategy also provides us an opportunity for scaling in. If the price is moving towards the Fibo target at 161.8 and the 5-period exponential MA crosses the 8-period simple MA from bottom to top (for a short position) or from top to bottom (for a long position) and then crosses it back, the open price of the candlestick after the crossover is the additional entry point. In that case, we place our take profit at the 261.8 Fibo level. Also, it is recommended to trail your stop loss after scaling in.
For example, on the same chart, we entered the short position at 1.1706. We added more at 1.1678 when the exponential MA (violet) crossed the 8-period SMA (orange). We moved our level of take profit to 1.1614 (261.8 Fibo level). At the same time, we trailed the stop loss to the 78.6 Fibo level at 1.1708.

Conclusion
Today we’ve considered how small adaptations to Fibonacci levels may be applied to an efficient strategy. We recommend you to practice it on our Demo account before taking the full advantage out of it.

Bill Williams is the creator of some of the most popular market indicators: Awesome Oscillator, Fractals, Alligator, and Gator.

Trend strategies are good - they may give significantly good results in any time frame and with any assets. The main idea of the ADX Trend-Based strategy is to try to catch the beginning of the trend.

Counter-trend strategies are always the most dangerous but also the most profitable. We are pleased to present an excellent counter-trend strategy for working in any market and with any assets.


Your request is accepted.
We will call you at the time interval that you chose
Next callback request for this phone number will be available in 00:30:00
If you have an urgent issue please contact us via
Live chat
Internal error. Please try again later