

Williams’ Strategy
Bill Williams is the creator of some of the most popular market indicators: Awesome Oscillator, Fractals, Alligator, and Gator.

Don’t waste your time – keep track of how NFP affects the US dollar!
Data Collection Notice
We maintain a record of your data to run this website. By clicking the button, you agree to our Privacy Policy.

Beginner Forex Book
Your ultimate guide through the world of trading.

Check Your Inbox!
In our email, you will find the Forex 101 book. Just tap the button to get it!
Risk warning: ᏟᖴᎠs are complex instruments and come with a high risk of losing money rapidly due to leverage.
66.43% of retail investor accounts lose money when trading ᏟᖴᎠs with this provider.
You should consider whether you understand how ᏟᖴᎠs work and whether you can afford to take the high risk of losing your money.
Warning! Old version of the browser!
Press one of the icons below to proceed to the official website of the developer and download the latest version of your browser.

Online Forex broker
2022-08-26 • Updated
Information is not investment advice
Let’s discuss the effective strategy, which presents the mix of best ideas of well-known traders such as Larry Williams, Ralph Elliott and Alexander Elder. Step by step we will go through this strategy to make it clear for you. Are you ready? Let’s get started.
First of all, let’s introduce key definitions, that we will use in this strategy.
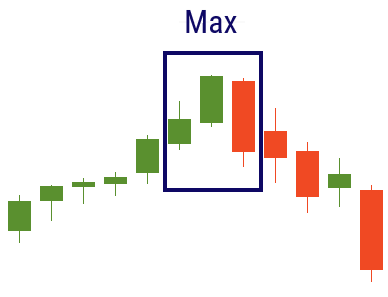
A maximum is a candlestick, which is located between two other candlesticks with lower highs. Moreover, it’s important that the next candlestick to the maximum should have lower low.
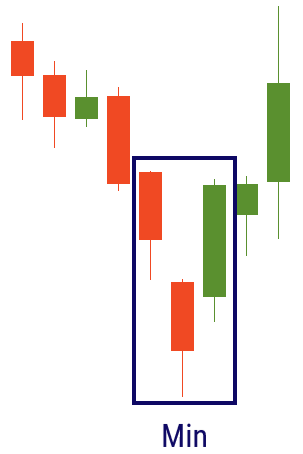
A minimum is a candlestick, which is located between two other candlesticks with higher lows. Moreover, it’s important that the next candlestick to the minimum should have higher high. Look at the examples below.
A trend is the general direction of the price of an asset on the market. Uptrend (bullish trend) consists of a series of higher highs and higher lows – prices are moving up. Downtrend (bearish trend) is classified as a series of lower lows and lower highs – prices are moving down. The best moment to enter the market is the trend reversal.
There are two ways to define a reversal:
1. If there is an uptrend and you find a minimum, draw a line through its close price. If after the breakout of this line two next consecutive candlesticks close lower than this line, it should be a trend reversal.

2. If there is a downtrend and you find a maximum, draw a line through its close price. If after the breakout of this line two next consecutive candlesticks close higher than this line, it should be a trend reversal.
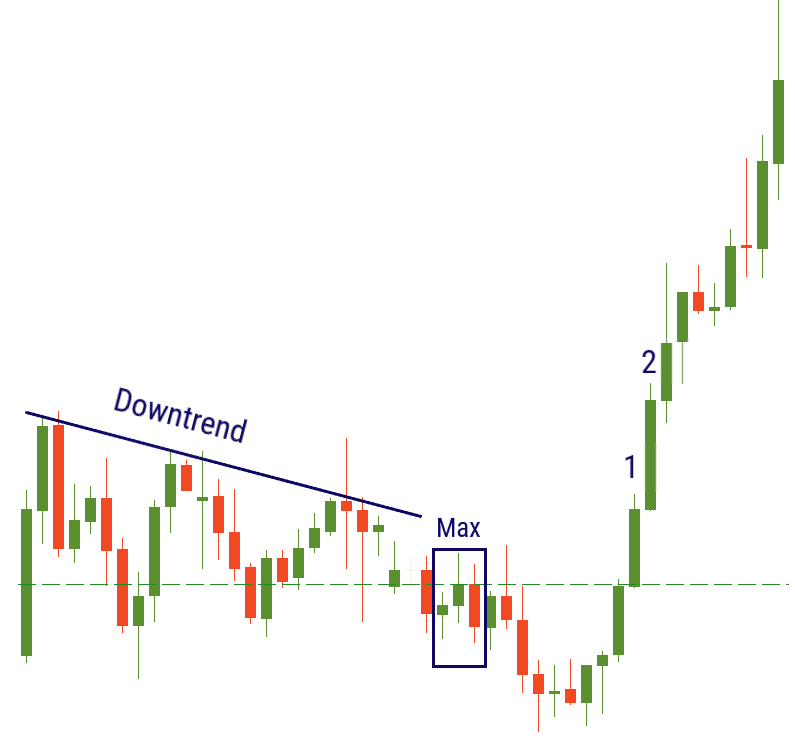
Ok, now we are able to define the reversal. Let’s try to find the right moment to enter the market. We will use the concept of Elder’s triple screen strategy. According to it, when there is a signal on a bigger timeframe, wait for it on a smaller timeframe and enter. Pay closer attention to all the conditions. Some steps may confuse you, but pictures will make everything clear.
Here’s below the detailed instruction:
1. Find the reversal of the trend on the daily chart as written above.
2. Switch to the 4-hour chart.
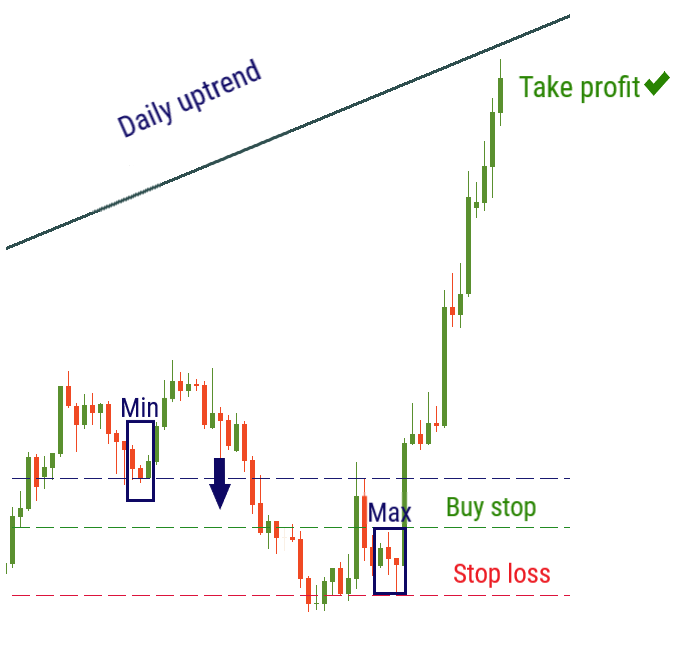
3. The 1st case: the uptrend occurs on the daily chart.
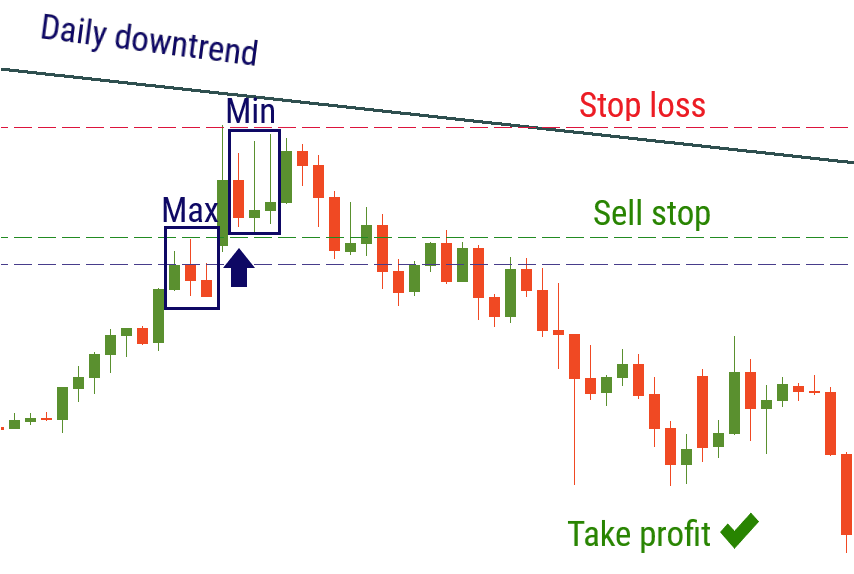
4. The 2nd case: the downtrend occurs on the daily chart:
*On the 4-hour chart you don’t need to wait for two consecutive candlesticks after the breakout of maximum or minimum level as we waited on the daily chart. You just need the breakout of this level.
Great! You’ve learned the new effective strategy! It’s really unique because of its simplicity and effectiveness. Stop losses will prevent you from failures. However, be aware that it’s better to avoid using this strategy in times of important economic events such as NFP releases. In addition, you can use not only the whole strategy, but also its parts: defining reversal of a trend, finding minimums and maximums and putting pending orders. Enjoy your trading!

Bill Williams is the creator of some of the most popular market indicators: Awesome Oscillator, Fractals, Alligator, and Gator.

Trend strategies are good - they may give significantly good results in any time frame and with any assets. The main idea of the ADX Trend-Based strategy is to try to catch the beginning of the trend.

Counter-trend strategies are always the most dangerous but also the most profitable. We are pleased to present an excellent counter-trend strategy for working in any market and with any assets.


Your request is accepted.
We will call you at the time interval that you chose
Next callback request for this phone number will be available in 00:30:00
If you have an urgent issue please contact us via
Live chat
Internal error. Please try again later