


Williams’ Strategy
Bill Williams is the creator of some of the most popular market indicators: Awesome Oscillator, Fractals, Alligator, and Gator.

Don’t waste your time – keep track of how NFP affects the US dollar!
Data Collection Notice
We maintain a record of your data to run this website. By clicking the button, you agree to our Privacy Policy.

Beginner Forex Book
Your ultimate guide through the world of trading.

Check Your Inbox!
In our email, you will find the Forex 101 book. Just tap the button to get it!
Risk warning: ᏟᖴᎠs are complex instruments and come with a high risk of losing money rapidly due to leverage.
70.72% of retail investor accounts lose money when trading ᏟᖴᎠs with this provider.
You should consider whether you understand how ᏟᖴᎠs work and whether you can afford to take the high risk of losing your money.
Warning! Old version of the browser!
Press one of the icons below to proceed to the official website of the developer and download the latest version of your browser.

Online Forex broker
2022-09-22 • Updated
Information is not investment advice
Many traders use the Rate of Change indicator to determine the price’s momentum. Traders and experienced users of technical analysis may have already tried and evaluated this tool in MetaTrader 4 and 5. In this article, we’ll analyze this indicator and its features.
Rate of Change (ROC) is a technical indicator of momentum, which measures the percentage change in price between the current price and the price a certain number of periods ago.
This indicator is plotted relative to zero, with the indicator moving up into the positive territory if the price rises and the negative territory if the price falls.
The main step in ROC calculation is the choice of the "n" value. ROC tracks the relationship between closing prices over two periods. In the standard calculation, the period is 12. On the daily chart, it considers the closing price 12 days ago and subtracts it from the current closing price. The difference is plotted as ROC. From time to time, it can be a positive or negative number.
ROC = [(Close – Close n periods ago) / (Close n periods ago)] * 100
Therefore, the center reference line is plotted as zero.
These two indicators are very similar and will give similar results if the exact value of n is used in each indicator. The main difference is that ROC divides the difference between the current price and the price n periods ago by the price n periods ago and expresses it in percent. Most calculations for the momentum indicator don’t do it. Instead, the price difference is simply multiplied by 100, or the current price is divided by the price n periods ago and then multiplied by 100. Both indicators tell similar stories, although some traders may prefer one over the other as they may give slightly different readings.
Here’s how to trade the signals generated by the ROC indicator.
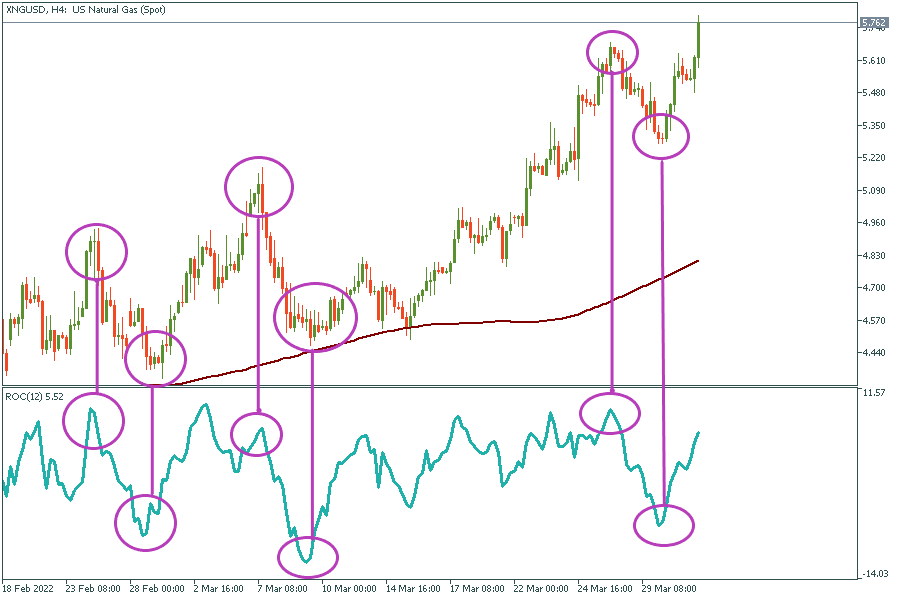
Momentum indicators are ideal for trading ranged markets because they help you accurately predict pivot points. Momentum usually refers to a trend that continues to flow. If the trend starts losing momentum in a flat market, it's best to start looking for opportunities to trade in the opposite direction. Peaks and troughs can occur after a certain time or with a certain percentage movement. As an unrelated indicator, the ROC gives a clear indication of when to expect such reversals based on the previous printed levels of the indicator.
Breakouts come with strong momentum and ROC is the best indicator to spot breakouts. A sustained sharp rise or fall will confirm that a trend will continue in the future with more breakouts. ROC will print fixed values when the price is consolidating or in a range.
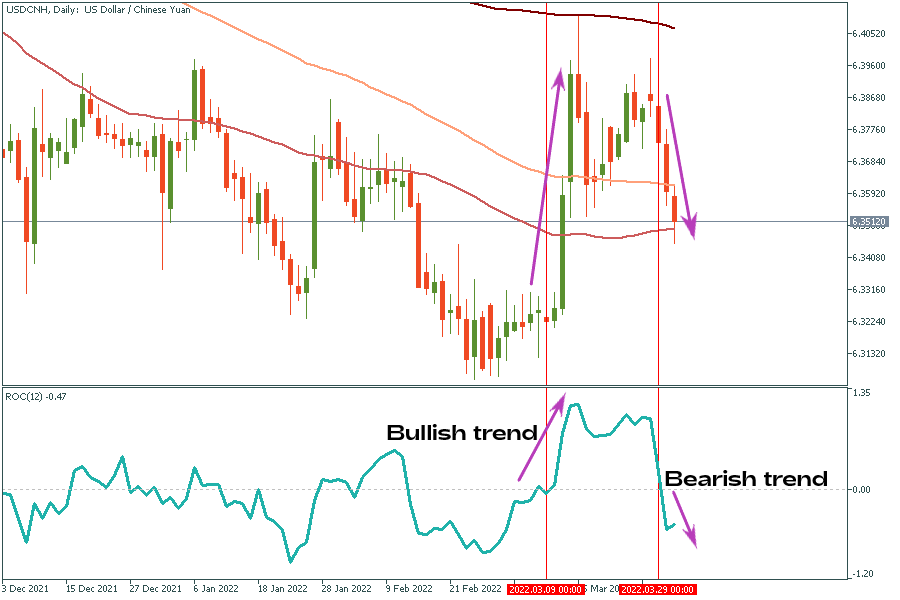
Crossing the zero line on the ROC indicates that a new trend is forming. For example, crossing the zero line from below indicates a bullish trend, while crossing from above indicates a bearish trend. Again, it’s important to consider the asset's volatility and the timeframe of the chart to minimize false or reversal ROC signals from zero-line crossovers.
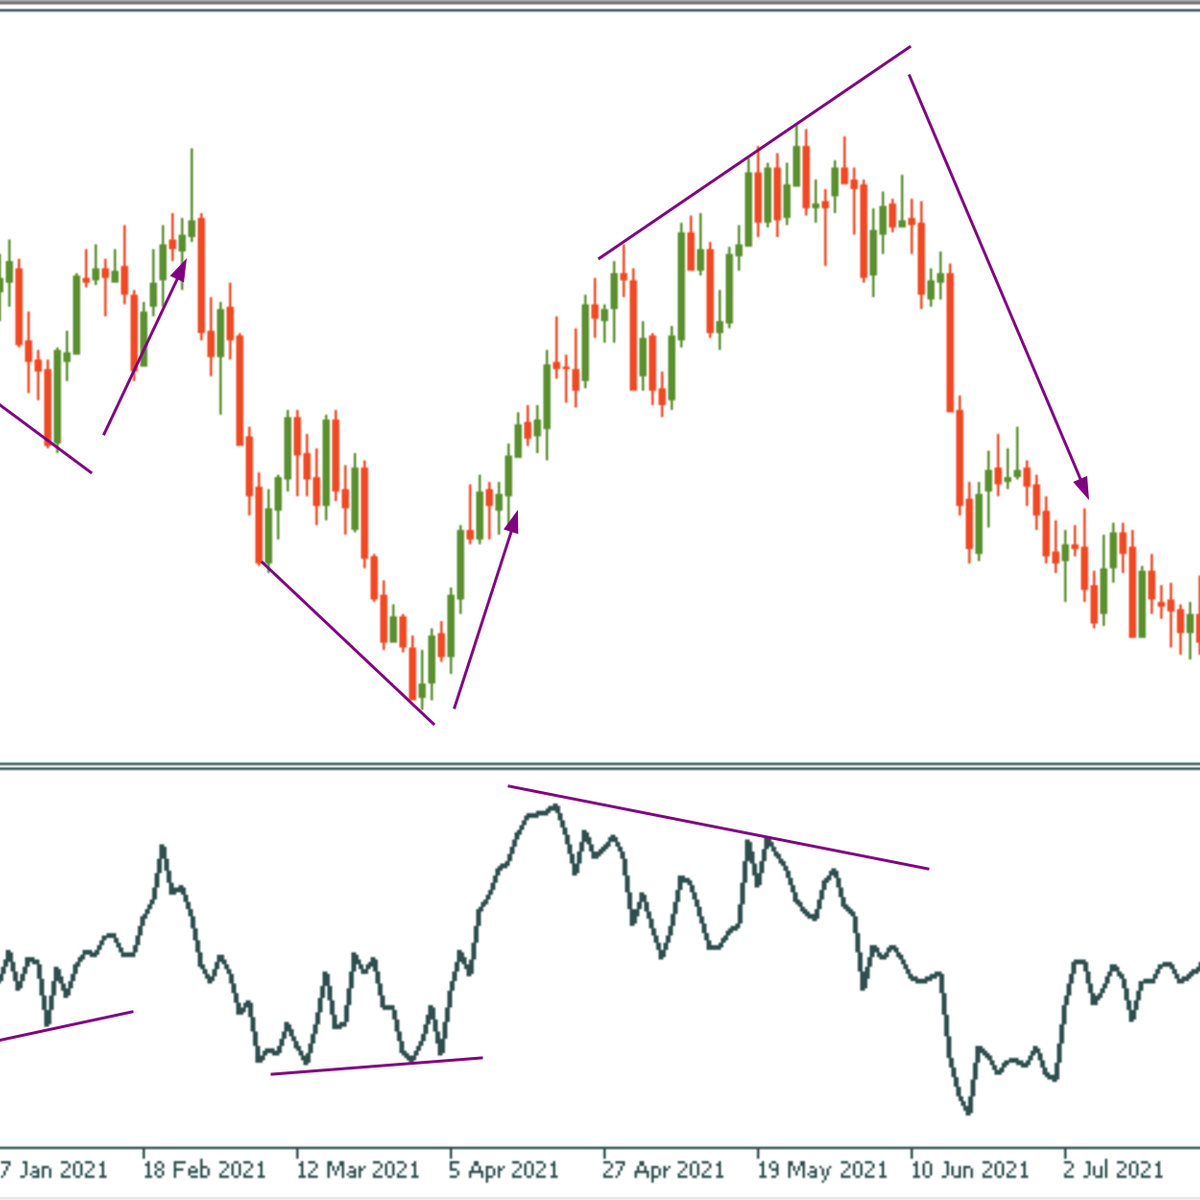
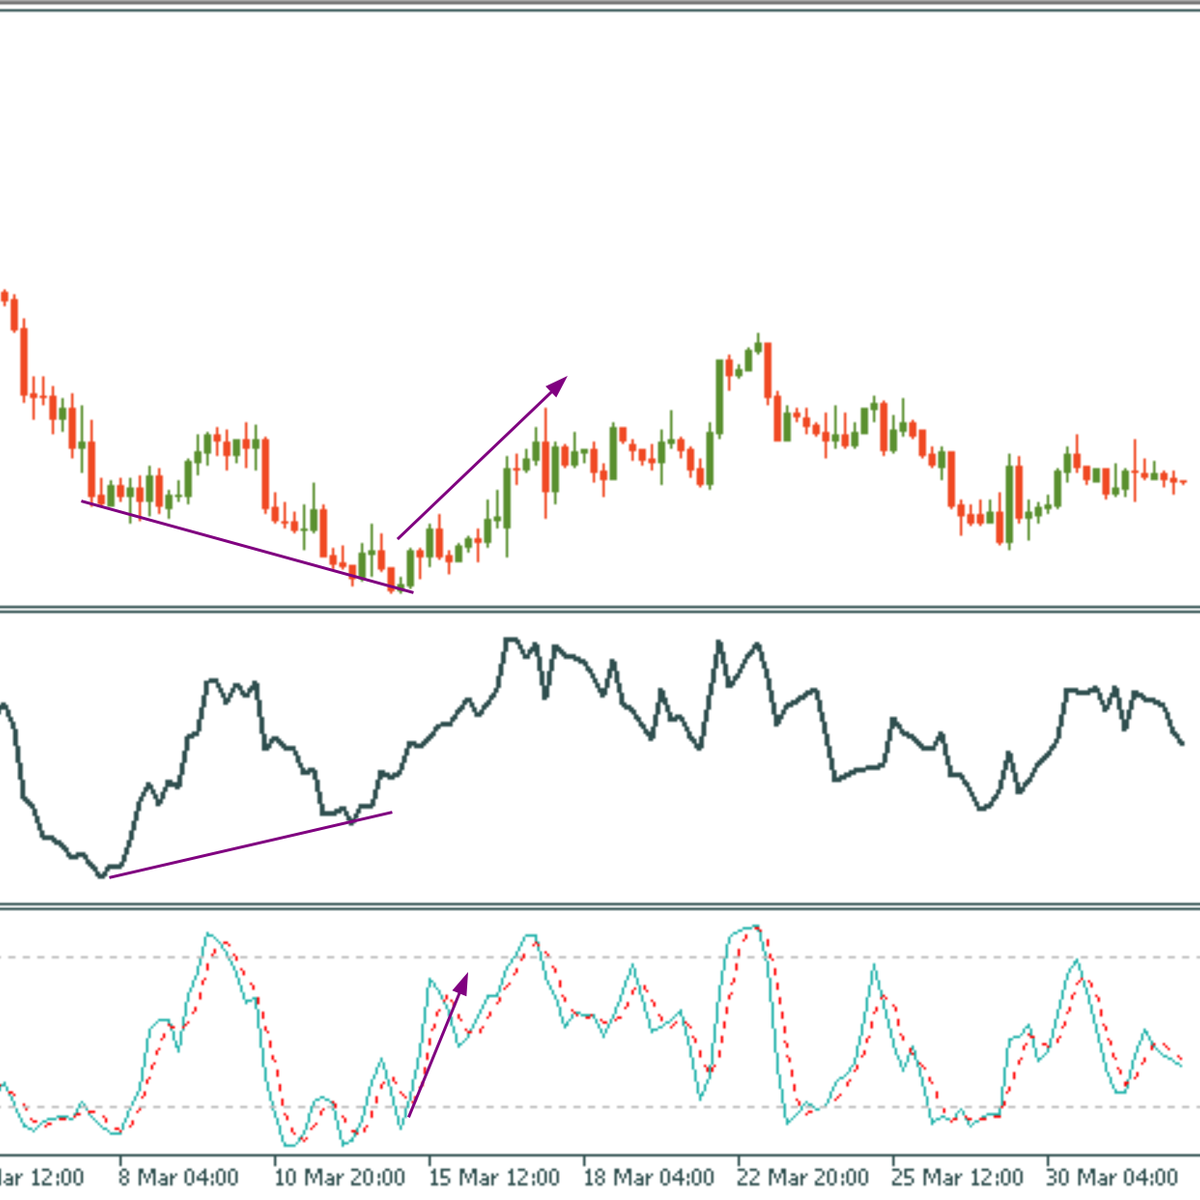
ROC bearish divergence is when you see a higher high on the price chart, while the Rate of Change line plots a lower high on to identify. Such situation indicates that an uptrend may end. If you see a lower low in price and a higher low in the Rate of Change line, a bullish divergence occurs with the possibility of switching from a downtrend to an uptrend. Hidden bearish divergence with the ROC is found when the ROC makes a new lower low and the price fails to make a new lower low. This is usually considered a bearish trend continuation signal. If the Rate of Change line makes a new higher high while the rising price fails to make a new higher high, this is called a hidden bullish divergence and may signal a continuation of the bullish trend.
Rate of Change indicator available in the MetaTrader platform is a visual representation of the current and historical ROC. ROC indicator in MetaTrader is a momentum indicator constructed as an oscillator. Rate of Сhange draws a line oscillating around the zero level, indicating the momentum of the current trend.
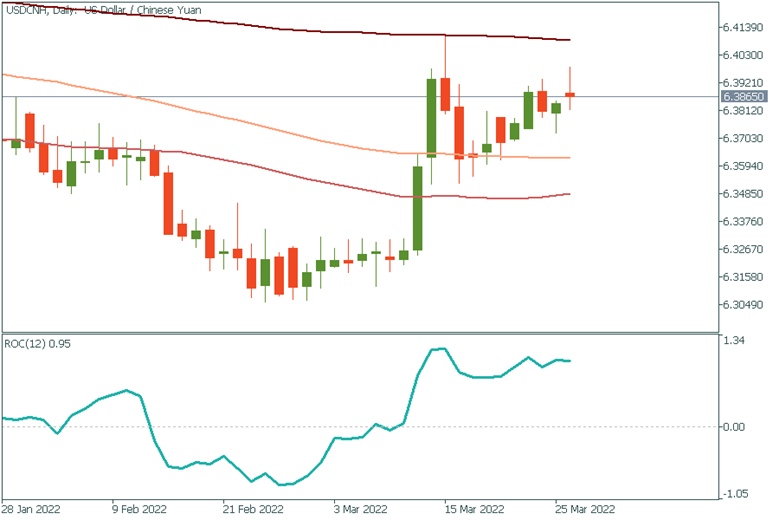
To add it to your chart, choose “Insert”, then click “Indicator”, and in the “Custom” section, you’ll find “ROC”.
As stated above, the ROC can sometimes give early or late signals. Therefore, it’s essential to look at some indicators together with ROCs that can generate confluence signals. Some of the best ROCs are combinations with Stochastic and Moving Averages.
This combination is best suited for determining the time of a trend reversal. When the ROC gives a divergence signal, traders can watch for Stochastic crossovers in the overbought or oversold zone to pick optimal exit points in anticipation of a trend reversal. For example, in case of a bullish pass, an entry into the oversold territory is chosen.
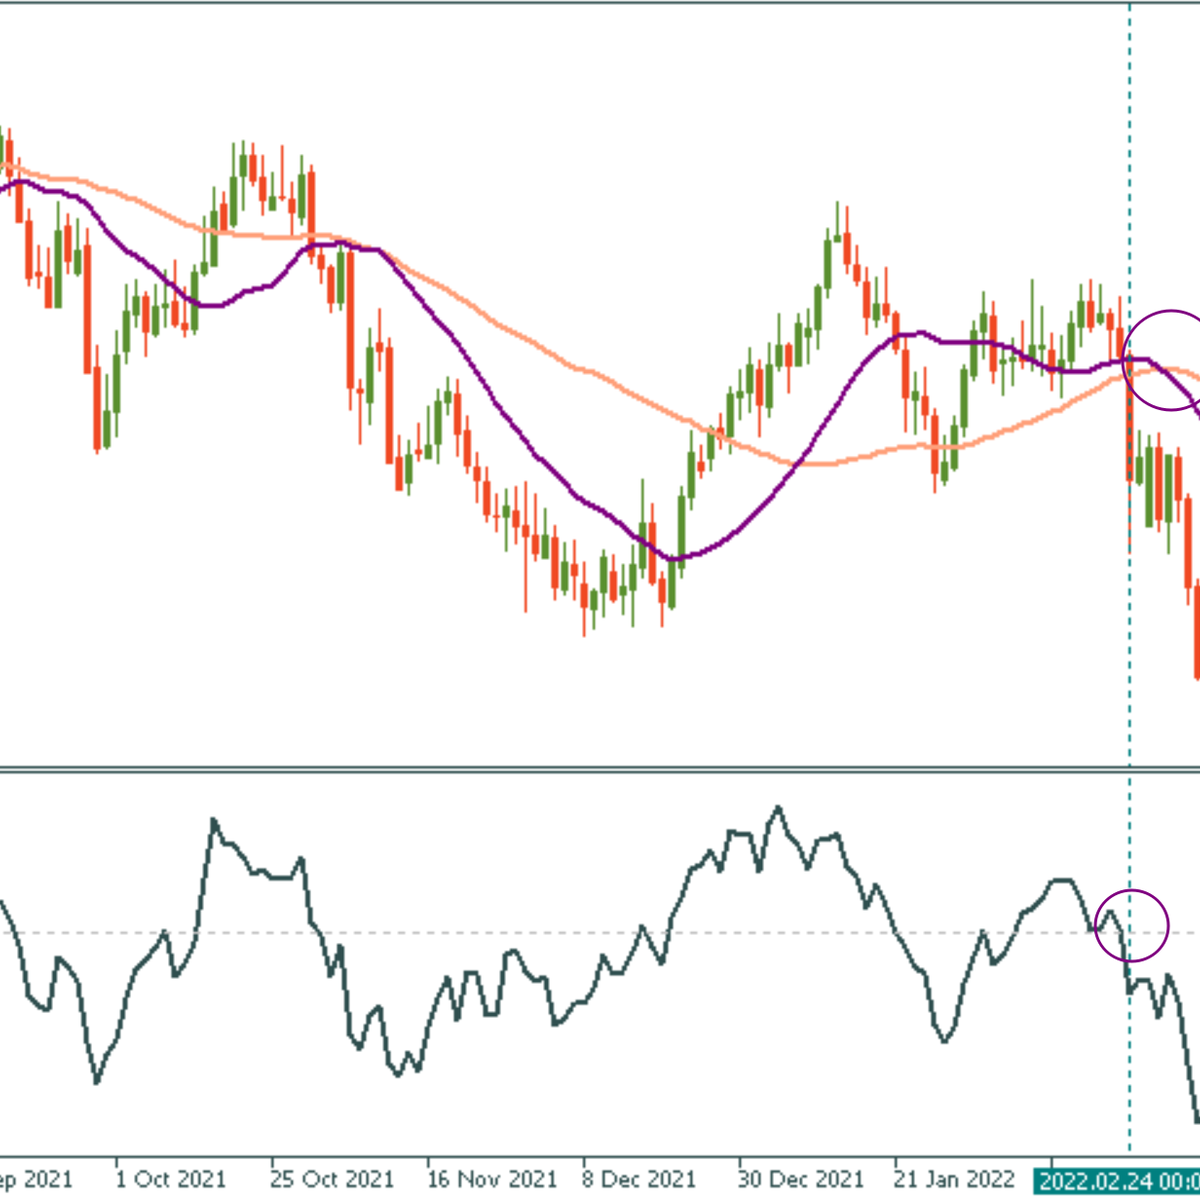
Crossing the ROC zero line can sometimes produce vague signals confirming a trend change. To test for a trend reversal, traders combine ROC with two indicators. For example, when the ROC has just crossed a zero line to signal a downtrend, confirmation will be received when the faster Moving Average crosses the slower downward moving trend.
To sum up, ROC indicator in MetaTrader can be used for trend following, trend reversal, and momentum detection. Knowing how to use it will boost your technical analysis skill and provide a more exciting experience in Forex trading!

Bill Williams is the creator of some of the most popular market indicators: Awesome Oscillator, Fractals, Alligator, and Gator.

Trend strategies are good - they may give significantly good results in any time frame and with any assets. The main idea of the ADX Trend-Based strategy is to try to catch the beginning of the trend.

Counter-trend strategies are always the most dangerous but also the most profitable. We are pleased to present an excellent counter-trend strategy for working in any market and with any assets.


Your request is accepted.
We will call you at the time interval that you chose
Next callback request for this phone number will be available in 00:30:00
If you have an urgent issue please contact us via
Live chat
Internal error. Please try again later