


Williams’ Strategy
Bill Williams is the creator of some of the most popular market indicators: Awesome Oscillator, Fractals, Alligator, and Gator.

Don’t waste your time – keep track of how NFP affects the US dollar!
Data Collection Notice
We maintain a record of your data to run this website. By clicking the button, you agree to our Privacy Policy.

Beginner Forex Book
Your ultimate guide through the world of trading.

Check Your Inbox!
In our email, you will find the Forex 101 book. Just tap the button to get it!
Risk warning: ᏟᖴᎠs are complex instruments and come with a high risk of losing money rapidly due to leverage.
66.43% of retail investor accounts lose money when trading ᏟᖴᎠs with this provider.
You should consider whether you understand how ᏟᖴᎠs work and whether you can afford to take the high risk of losing your money.
Warning! Old version of the browser!
Press one of the icons below to proceed to the official website of the developer and download the latest version of your browser.

Online Forex broker
2022-08-26 • Updated
Information is not investment advice
The price never follows straight lines. Usually, price movements can be described as so-called price waves. During the strong trend, every next high must be higher than the previous one and every next low should be higher than the previous one as well.
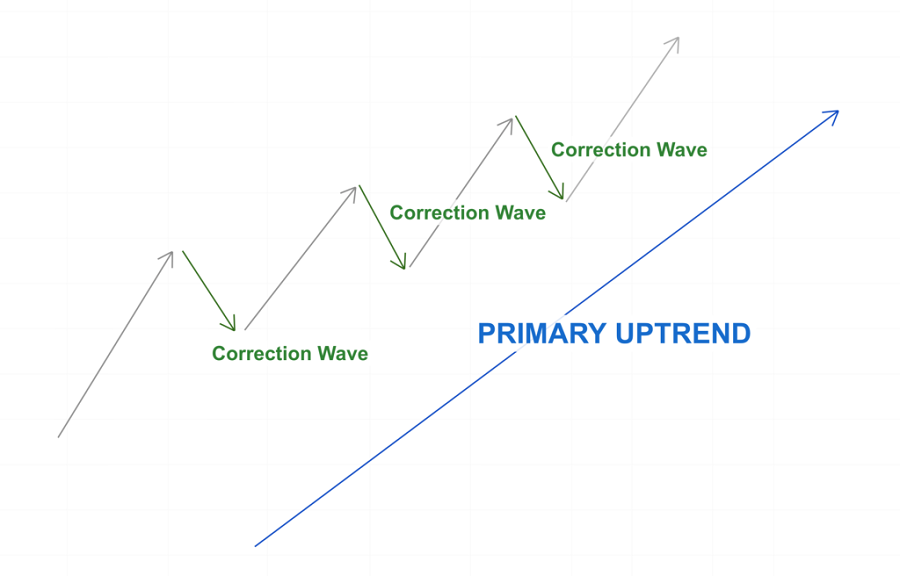
In the picture above a perfect example of the bullish trend is presented. As you can see there are three correction waves, which allow traders to enter the strong bullish market.
In this article, we will discuss how to pick the best point to enter the market during the correction.
Trend lines are the best trading instrument of all time. Even traders who swear off indicators draw them.
Generally speaking, a weak pullback points to trend strength. Vice versa, bigger pullback signals upcoming trend reversal.
John Hill, a famous trading writer, created the trend theory. This theory is simple, a trader needs to draw only two trend signal lines to define the trend power.
First, you need to learn how to draw signal lines.
Connect 0 and 4, 0 and 2.
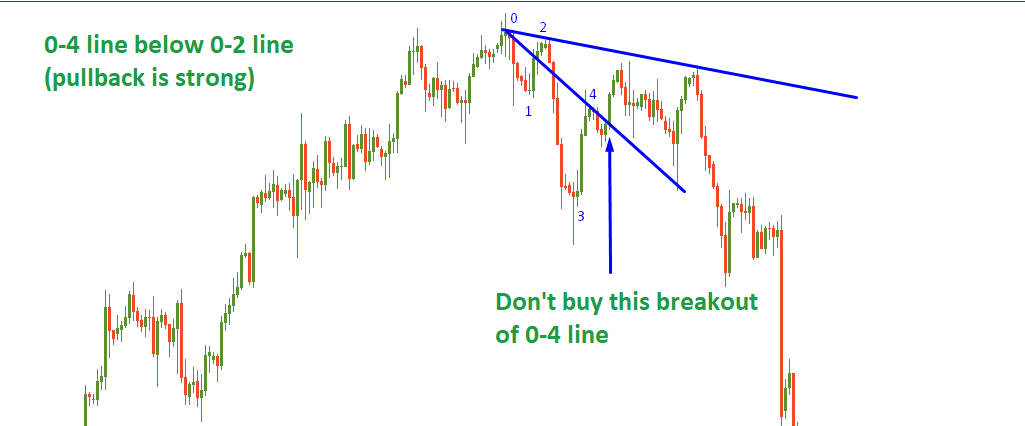
If during bullish trend the 0-4 line is steeper, the pullback has power. Avoid trading this pullback.
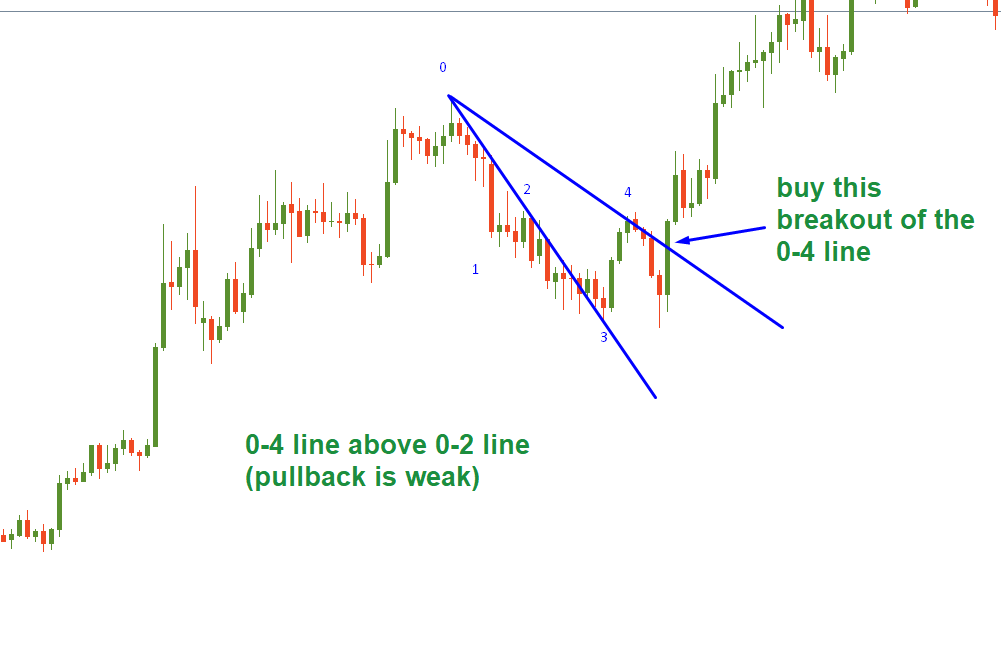
If during a bullish trend the 0-2 line is steeper, the pullback has no power. You might open a long trade as presented in the picture (when price breaks through the 0-4 line).
You might use this example during downtrends as well.
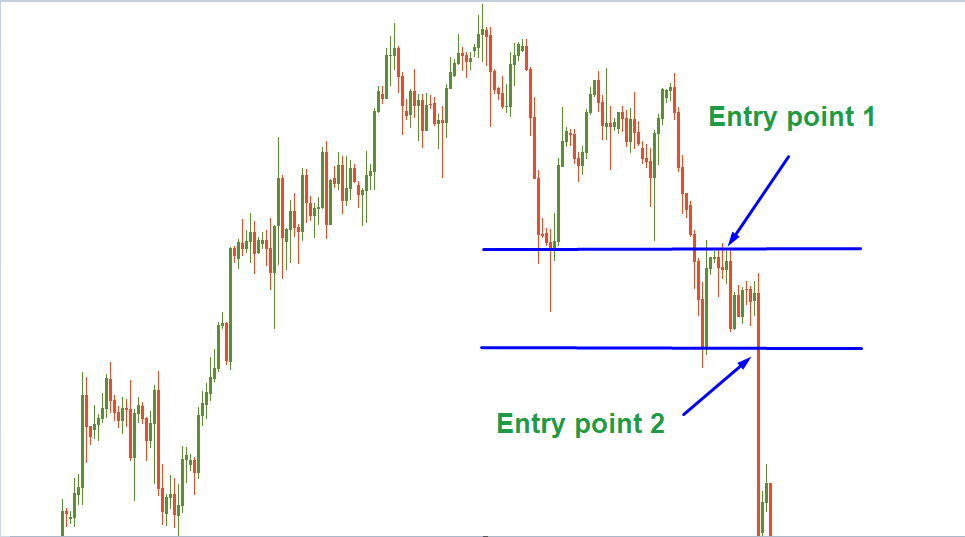
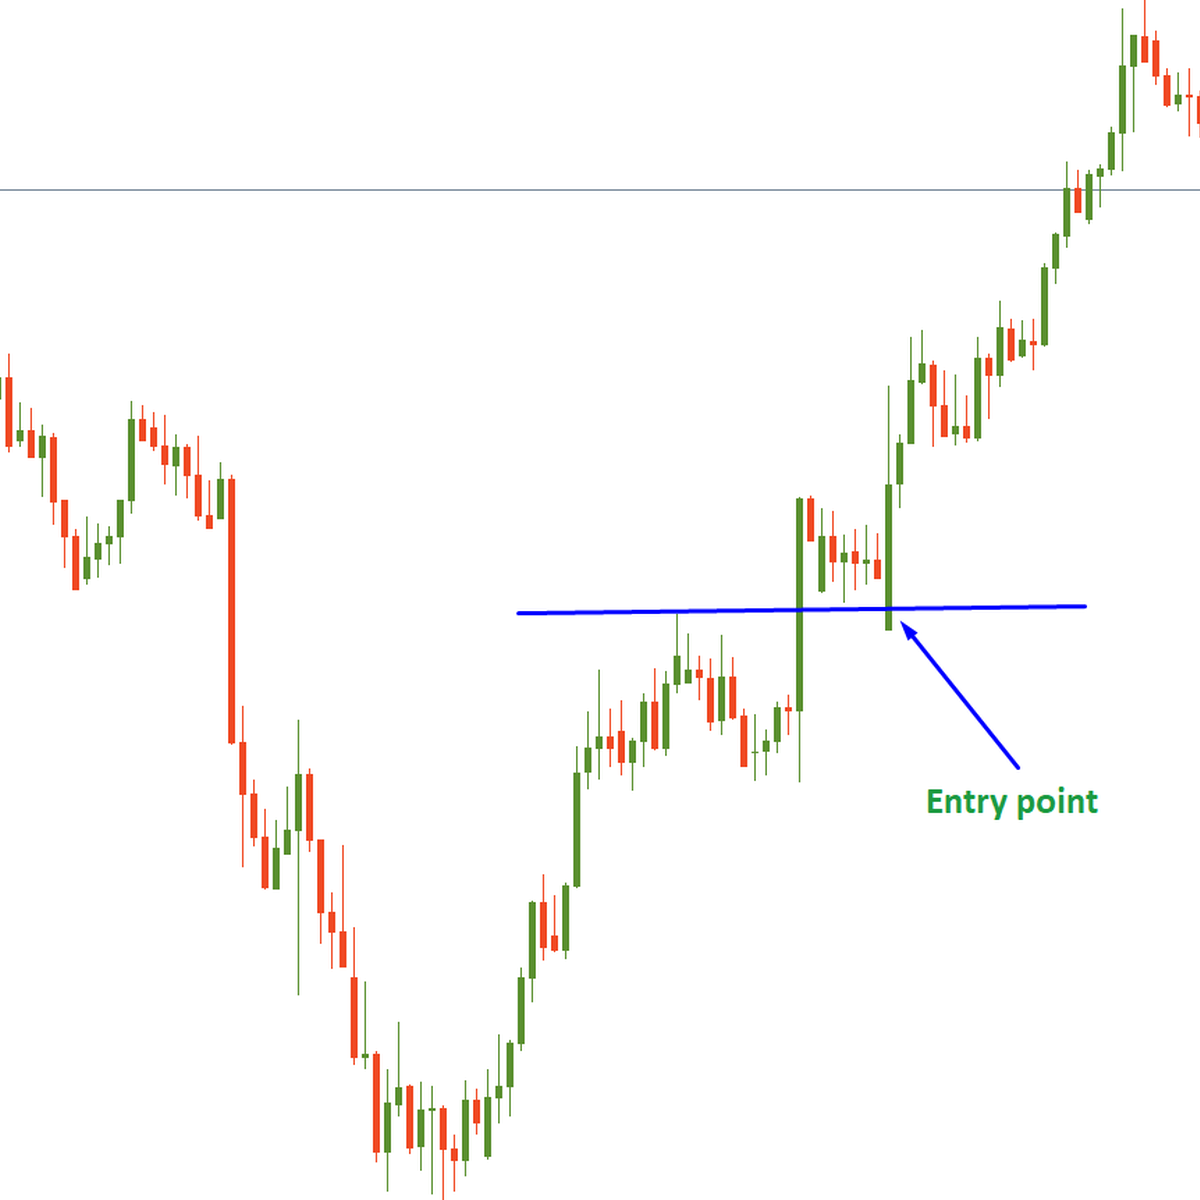
Breakout pullback is one of the most popular pullback strategies. This strategy is the most effective at the market turning points. During the strong trend, a price might consolidate in the channel and form support and resistance levels.
In the picture, you can see that the price broke through the first support level (upper blue line) and retested it from the below (after a breakout, the price usually returns to the level which has been broken through). In the moment of retest, an aggressive trader might open a short trade. In this case, the potential reward/risk ratio is highest because the price may get above the level and continue the uptrend.
The conservative trader should wait until the price continues the trend structure and breaks into a new low (lower blue line breakthrough). That is the second sell entry point. The conservative entry happens later and, therefore, the potential reward/risk ratio is also smaller.
During trend movement, the price always pulls back to accumulate powers for the next moves. Usually, the price returns to the previous high/low level and tests it from above/below during a bullish/bearish trend respectively. This pullback might be considered as an opportunity to find an alternative entry point for those who missed the initial entry opportunity.
Furthermore, a trader could also choose to use the stepping pattern to pull the stop loss behind the trend in a safer way. In this case, the trader waits until the price has completed a step in the direction of a trend and then pulls the stop loss behind the last pullback area. The trailing stop loss is then safely protected and not as vulnerable.
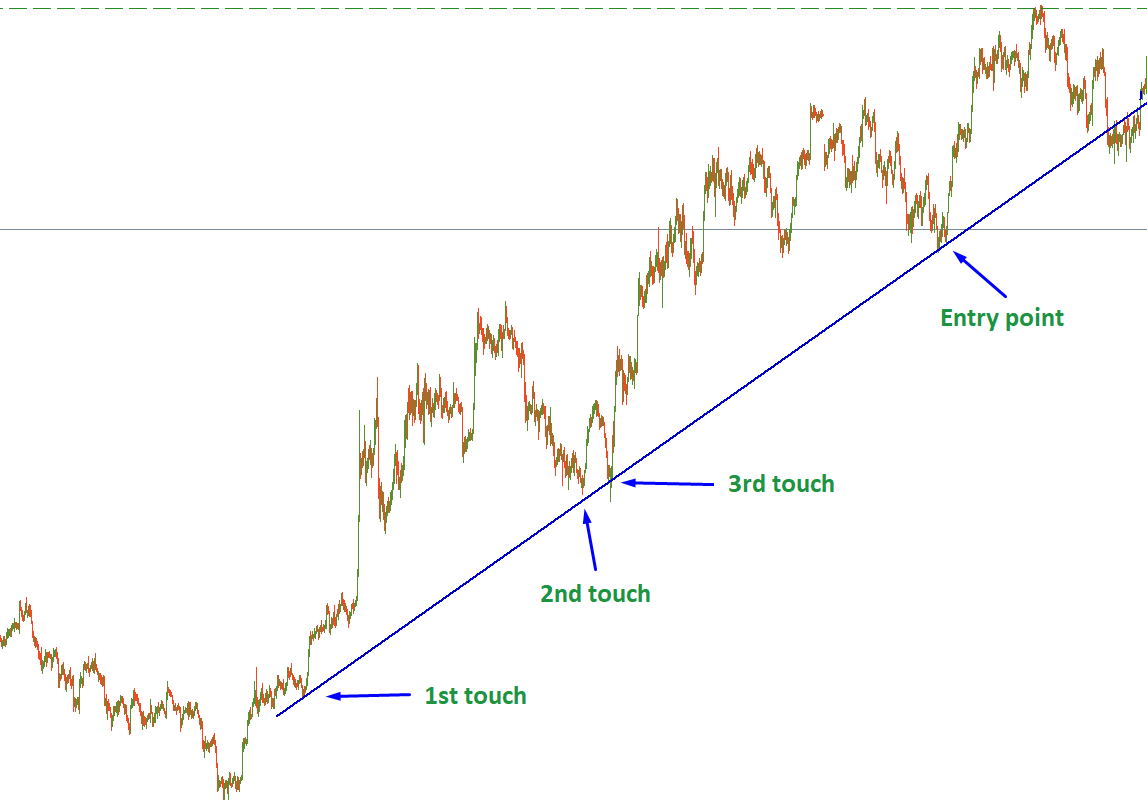
This is another famous method of trading pullbacks. The drawback is that trendlines often take longer to be validated. You can always connect two points, but trendline requires at least three touches. That’s why you can trade trend line pullback only at the 4th or 5th touch.
It is a good additional method, but as a standalone method, the trader may miss many opportunities.
In this article, we have discussed 4 strategies to trade pullbacks during an ongoing trend.
The first three strategies can be used separately, while the trendline is an additional option that can improve any of the presented strategies.
START TRADING WITH THIS STRATEGY

Bill Williams is the creator of some of the most popular market indicators: Awesome Oscillator, Fractals, Alligator, and Gator.

Trend strategies are good - they may give significantly good results in any time frame and with any assets. The main idea of the ADX Trend-Based strategy is to try to catch the beginning of the trend.

Counter-trend strategies are always the most dangerous but also the most profitable. We are pleased to present an excellent counter-trend strategy for working in any market and with any assets.


Your request is accepted.
We will call you at the time interval that you chose
Next callback request for this phone number will be available in 00:30:00
If you have an urgent issue please contact us via
Live chat
Internal error. Please try again later