


Williams’ Strategy
Bill Williams is the creator of some of the most popular market indicators: Awesome Oscillator, Fractals, Alligator, and Gator.

Don’t waste your time – keep track of how NFP affects the US dollar!
Data Collection Notice
We maintain a record of your data to run this website. By clicking the button, you agree to our Privacy Policy.

Beginner Forex Book
Your ultimate guide through the world of trading.

Check Your Inbox!
In our email, you will find the Forex 101 book. Just tap the button to get it!
Risk warning: CFDs are complex instruments and come with a high risk of losing money rapidly due to leverage.
66.43% of retail investor accounts lose money when trading CFDs with this provider.
You should consider whether you understand how CFDs work and whether you can afford to take the high risk of losing your money.
Warning! Old version of the browser!
Press one of the icons below to proceed to the official website of the developer and download the latest version of your browser.

Online Forex broker
2022-10-21 • Updated
Information is not investment advice
A diamond chart pattern is a technical analysis pattern commonly used to detect trend reversals. It’s a rather rare pattern. It occurs when the price starts to flatten after a steady uptrend or downtrend, which leaves a diamond-shaped formation on the chart.
In this article, you will find answers to the following:
The diamond formation is a classic chart pattern. However, it doesn’t appear as often as flags, head-and-shoulders, or rectangle patterns. There aren’t many opportunities to trade the diamond chart pattern. However, technical traders should become familiar with this pattern as it provides a good trading opportunity if recognized early enough.
The diamond pattern most often occurs after an extended trend phase. During a bull market, the pattern is referred to as a diamond top or a bearish diamond pattern as the price reverses and begins a downward movement after this pattern. Conversely, the pattern is referred to as a diamond bottom or a bullish diamond pattern due to its bullish meaning when a diamond occurs in a bear market.
The diamond chart pattern is so rare because it takes quite a while to form. First, it should form the support and resistance lines, diverging almost at strong angles to the horizontal lines, then converging again in one structure. The result is a diamond shape. That’s how it got its name.
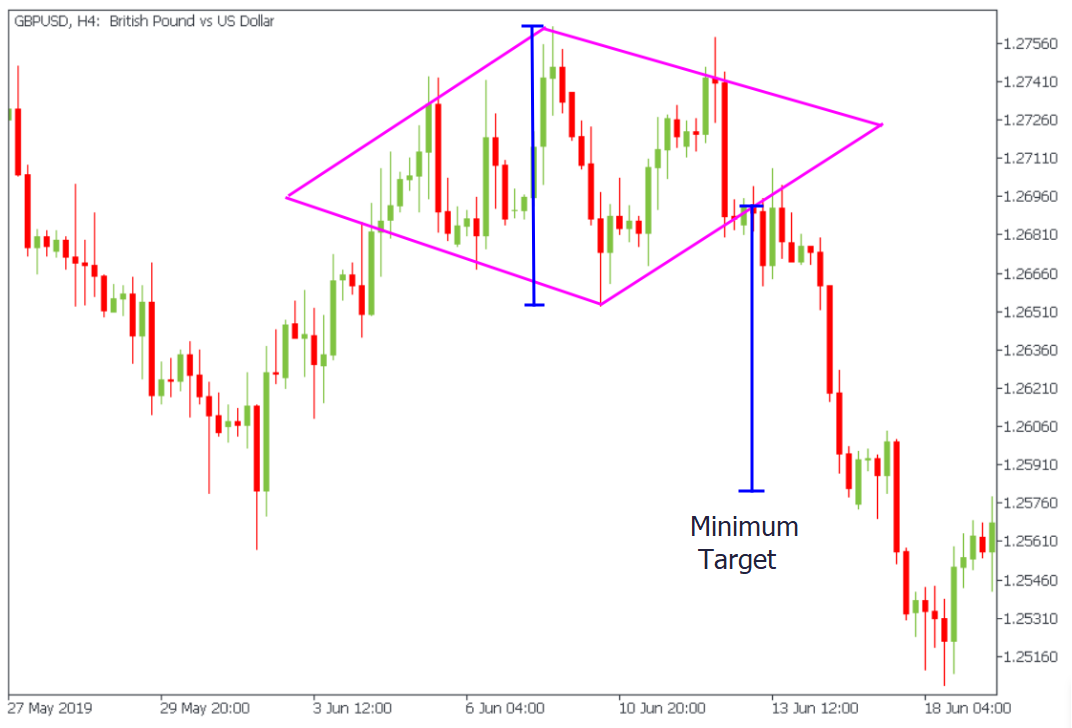
The chart below shows the GBPUSD diamond chart pattern from June 7, 2019.
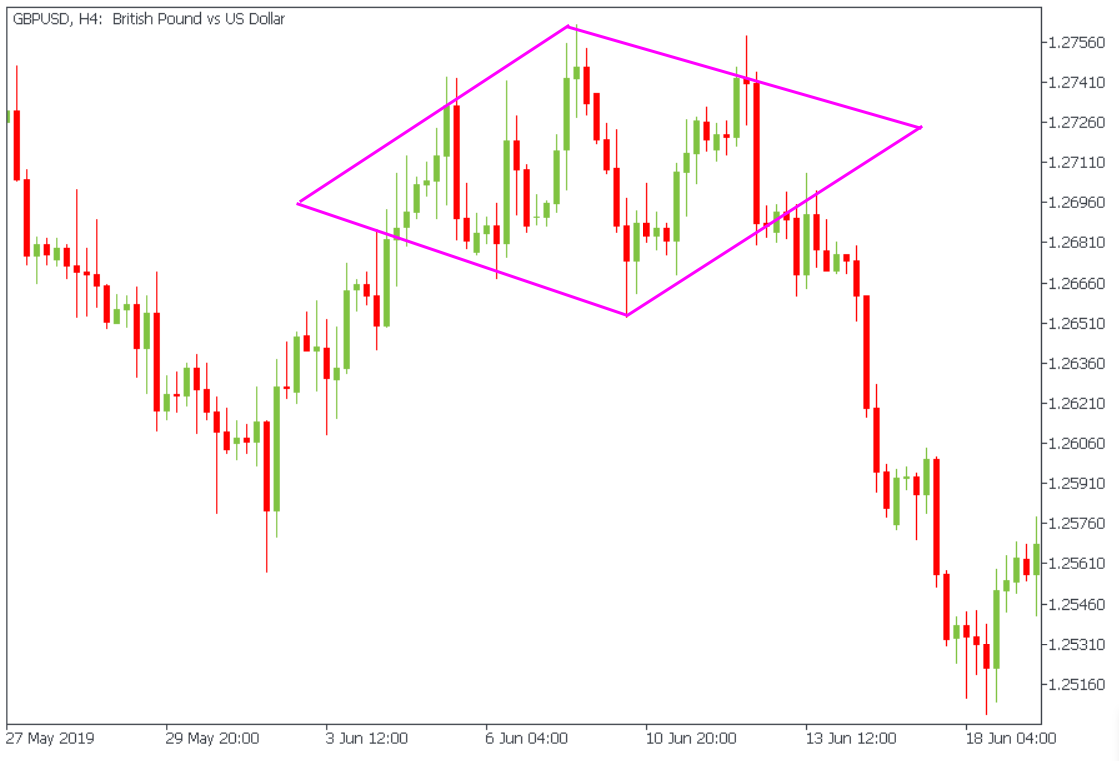
In reality, the patterns are not as neat and even as in the diagrams. But if the pattern conforms to the logic of both highs and lows and has a more or less rhombus shape, it’s a diamond.
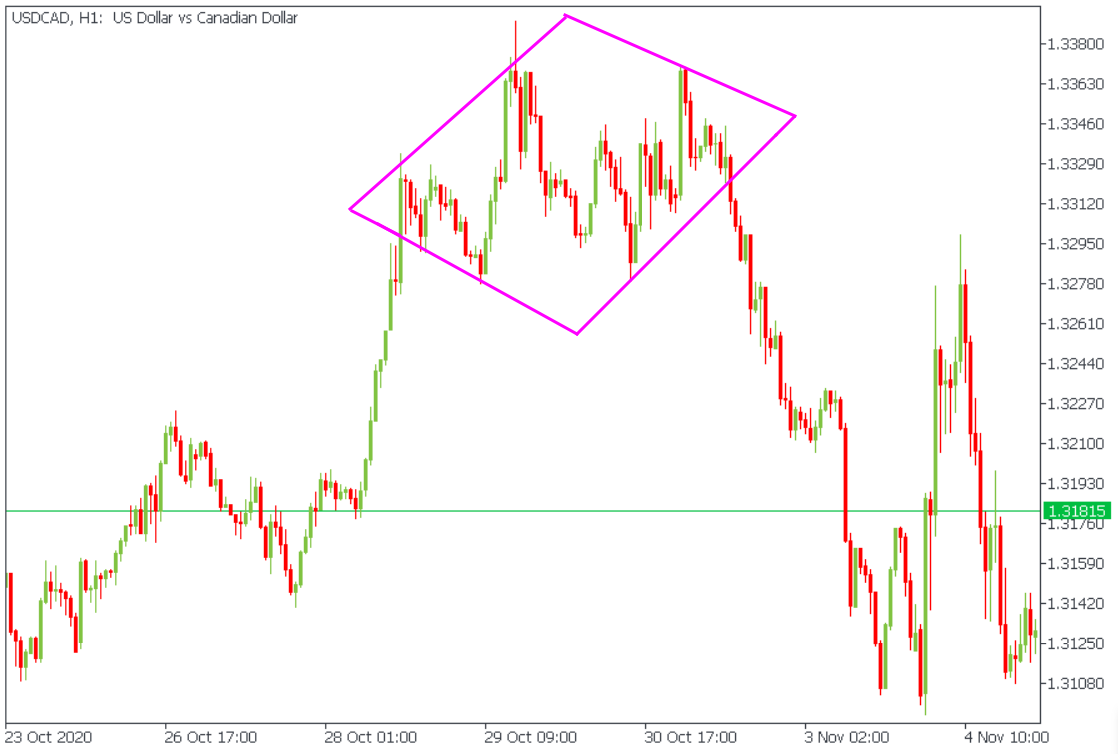
A variation of the bearish diamond, also known as the diamond top, was described in the previous section. Traders can view the pattern as a series of up-and-down price swings that resemble a head-and-shoulders pattern structure.
Specifically, the left shoulder and the head will join to form a trend line, while the head and the right shoulder will form a second trend line. It completes the trend lines for the top of the bearish diamond formation. Then, for the bottom part, we'll connect the swing lows inside the troughs, forming a V-shape.
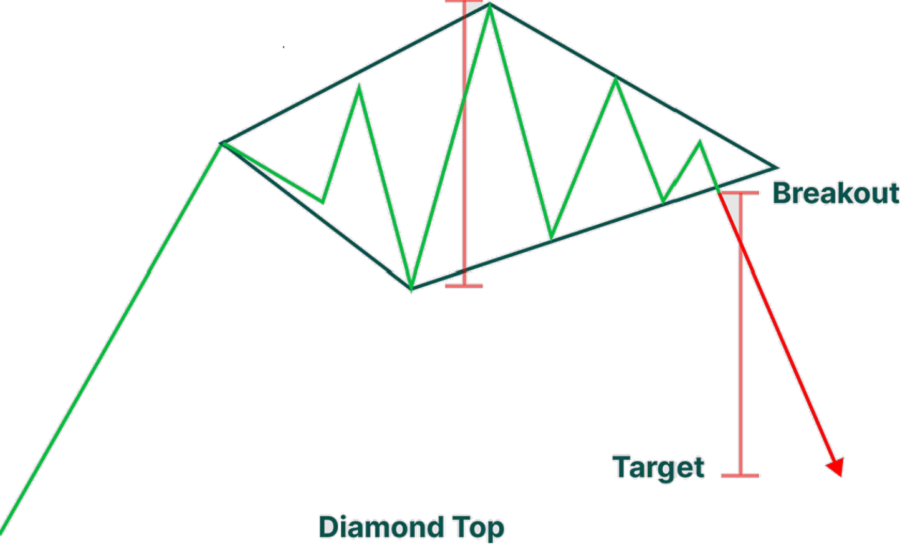
The illustration above shows us the bearish diamond pattern again. This chart shows a breakout entry signal for trading the diamond structure and a target level for the pattern. The short entry signal will be triggered by the breakout and close below the lower right line slanting upward.
Some traders prefer to wait only for a break below this line without a requirement for a close below it. This is also a possible entry point; however, be aware that it will result in more false signals than waiting for a breakout and a close condition.
The target price for the structure is calculated using the measured movement method. Specifically, we want to measure the distance from a peak to a trough within a structure and then project that distance down from the breakout point. It will provide a level where we can expect the continuation of the breakout to begin to wane or possibly reverse. Thus, it represents an excellent Take Profit and exit level.
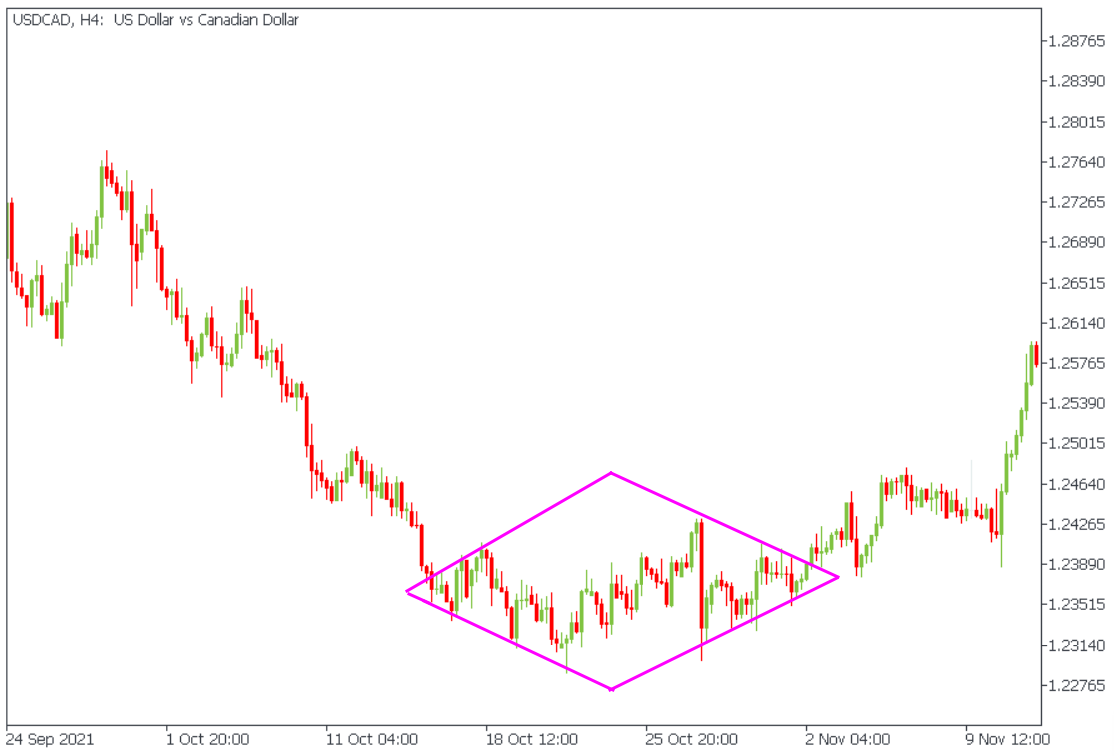
Let's now look at the opposite of the bearish diamond, which is a bullish diamond. A bullish diamond pattern, called a diamond bottom, occurs after a downtrend. We usually see a substantial price move down and then a consolidation phase that carves up and down swing points on a diamond bottom.
In this case, the appearance will resemble an inverted head and shoulders pattern. We will connect the peaks and troughs within the structure in the same way as described earlier. Once we draw four trend lines around the structure and confirm that the four lines are roughly equivalent in size, we can confirm the structure as a bullish diamond pattern.
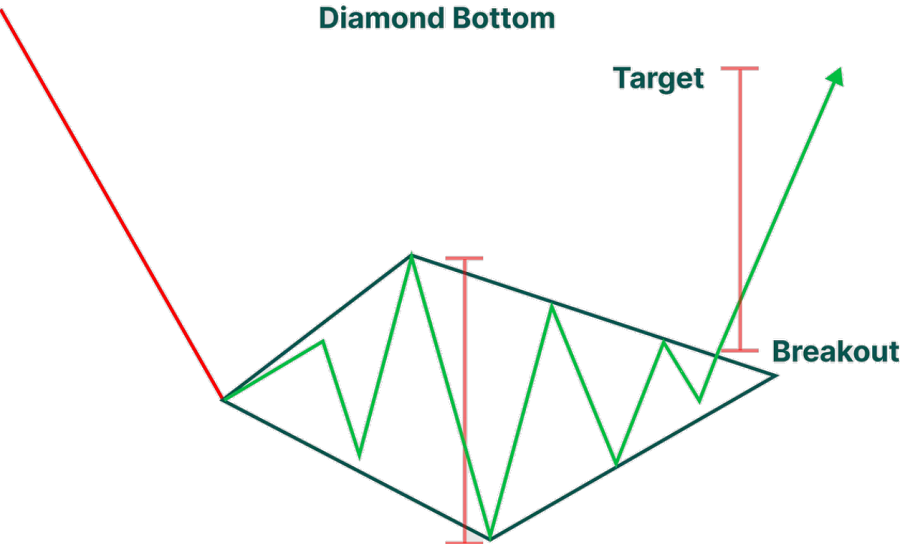
Looking at the diamond bottom illustration above, we see that a downward price move precedes the formation. An ascending sequence in a diamond structure is outlined by two upper trend lines pointing down and two lower trend lines pointing up.
A break and close above the upper right line with a downward slope triggered the signal to open a long position. Again, the preferred method would be to wait for an actual breakout and close rather than just a breakout above this trendline to prevent false signals and potential price movement around this area.
Calculating the upper price target is reasonable by measuring the high and the low inside the closed structure. Once we calculate this distance and plot it on the chart, we’ll extend the same distance from the upward projected breakout point to reach our preferred target level. Once the price reaches this level, we should consider closing the entire position, or at least a large part of it, and possibly leaving a smaller part open if necessary.
Even though diamond chart patterns are widely considered reversal, they can surprise traders. Not all diamond patterns change the trend direction, so it’s essential to remember that diamond continuation patterns also exist.
A diamond continuation pattern happens when the price breaks out of a consolidation period in the same direction as the primary trend. Like in reversal diamond patterns, the price creates high and low peaks but then narrows its range and, after a while, goes back on track in the same direction as the main trend.
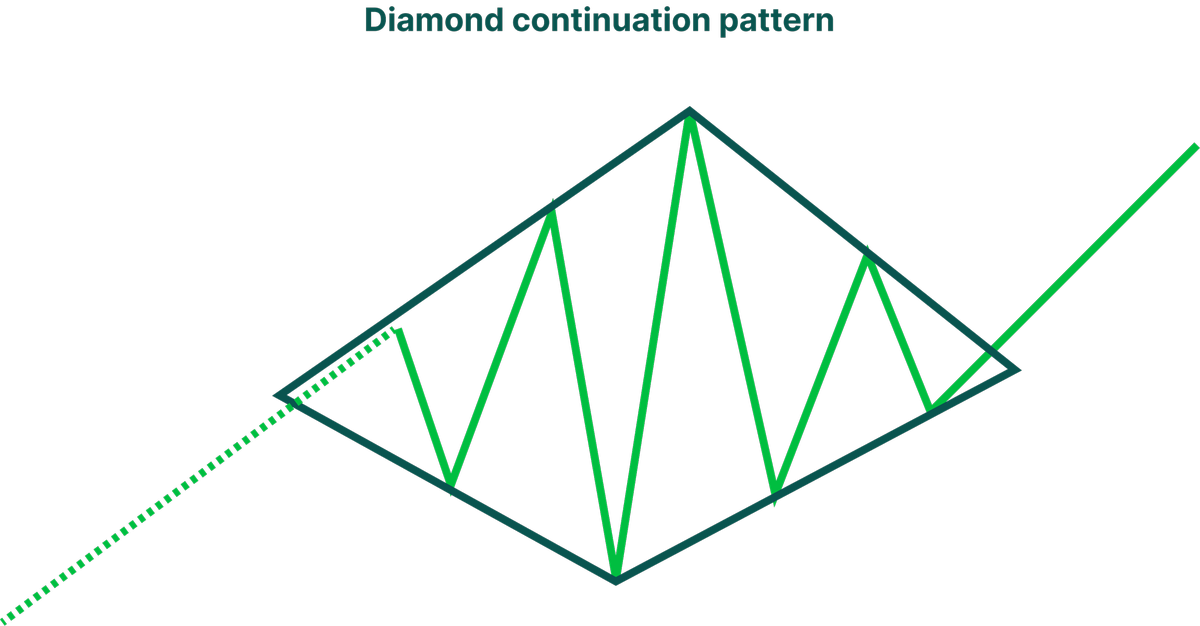
A diamond continuation pattern also takes a lot of time to develop and take shape, so you have enough time to use other methods and tools to see whether the trend reversal is likely or if the price will continue in the same direction.
Unfortunately, no pattern can predict market price movements with 100% accuracy. Diamond chart patterns don’t always predict trend reversals. Sometimes, the price can break out and continue moving in the same direction as before. So it’s essential to wait for a reversal confirmation or use other methods to gain more insight into the momentum.
For example, one of the tools often used in such cases is a price oscillator. It can show whether the asset has been oversold or overbought. Another way is to use the moving average indicator and the Relative Strength Index. Applying these tools to a chart with a diamond chart pattern can help you understand the direction of the price movement more and see the potential break of support or resistance.
When you’re ready to use the diamond pattern to your advantage, you’ll probably start to wonder how you can use it. The first thing you need to remember is that the minimum price move you can expect from this pattern is the same as the formation size. So to find out when you can close your position and Take Profit, you need to:
Once the price breaks this level, you can exit the trade. You can also wait a bit because this line might not be the end of the price move, and use other methods (like a volume-weighted moving average) to check if there are any possible exit points.
Let's now focus on creating a trading strategy with a diamond pattern. We’ve seen that the technical formation of a diamond occurs both in the context of an uptrend and a downtrend. When a bullish price action precedes a diamond pattern, it is called a diamond top with bearish overtones. When a diamond pattern precedes a bearish price move, it is called a diamond bottom, which has a bullish connotation.
We’re aware that the diamond pattern isn’t widespread in the market. Thus, we don't want to add too many variables to the strategy that could filter out an otherwise good setup. We’ll try to keep it as simple as possible using a pure price action approach in this diamond trading strategy.
Here are the rules for trading the diamond top chart pattern:
The trading rules for the diamond bottom chart pattern are the complete opposite:
Diamond chart patterns are an excellent tool for trading Forex. Moreover, it’s also simple to utilize in your Forex trading strategy. When you spot a diamond pattern on your chart, here’s what you need to do.
Traders often confuse diamond patterns with head-and-shoulders patterns as they have similar shapes. But there are specific differences that can tell you which pattern exactly you’re dealing with.
As with all patterns, diamond chart patterns have both advantages and disadvantages.
The advantages include the following:
The disadvantages of diamond chart patterns are:
So even if you think you’ve found a diamond in your chart, don’t rush into making a decision. Try other technical analysis tools to be sure that the reversal is about to happen, and only then decide whether you want to act on it or not.
Diamond chart patterns are most common in the Forex market but can also apply to other asset classes. This also includes crypto charts. However, crypto differs from other asset types. So before applying diamond charts for cryptos, make sure you understand how crypto trading works – knowing what’s right in the crypto market can make or break your trade.
Diamond reversal patterns are seen in all financial markets, including the stock market, Forex market, cryptocurrency market, and futures markets. The diamond pattern is not as common as many other classic chart patterns. However, it’s vital that you understand the pattern and recognize it because it can provide an excellent trading opportunity when it occurs.
A diamond top that occurs after a rise in market prices generally provides a higher probability of a trade than a diamond bottom pattern after a decline in market prices. You’ll need to do your testing to see if this trend matches the markets you are trading.
Diamond chart patterns can occur in any timeframe, so you technically can trade them in any timeframe you want. But they are the most accurate and reliable when they occur in longer timeframes since shorter timeframe diamonds are more likely to give a false signal in a shorter timeframe.
Although diamond tops appear more often than diamond bottoms, neither is more accurate than the other. Both patterns are used to spot potential trend reversals.
Yes, diamond chart patterns are considered reliable reversal indicators. However, no indicator or tool is 100% accurate, so using other indicators and methods is essential to ensure the price movement will reverse.
Diamond chart patterns are among the most reliable reversal indicators. However, they are not easy to spot, so traders rarely get the chance to use them.

Bill Williams is the creator of some of the most popular market indicators: Awesome Oscillator, Fractals, Alligator, and Gator.

Trend strategies are good - they may give significantly good results in any time frame and with any assets. The main idea of the ADX Trend-Based strategy is to try to catch the beginning of the trend.

Counter-trend strategies are always the most dangerous but also the most profitable. We are pleased to present an excellent counter-trend strategy for working in any market and with any assets.


Your request is accepted.
We will call you at the time interval that you chose
Next callback request for this phone number will be available in 00:30:00
If you have an urgent issue please contact us via
Live chat
Internal error. Please try again later