


Williams’ Strategy
Bill Williams is the creator of some of the most popular market indicators: Awesome Oscillator, Fractals, Alligator, and Gator.

Don’t waste your time – keep track of how NFP affects the US dollar!
Data Collection Notice
We maintain a record of your data to run this website. By clicking the button, you agree to our Privacy Policy.

Beginner Forex Book
Your ultimate guide through the world of trading.

Check Your Inbox!
In our email, you will find the Forex 101 book. Just tap the button to get it!
Risk warning: ᏟᖴᎠs are complex instruments and come with a high risk of losing money rapidly due to leverage.
66.43% of retail investor accounts lose money when trading ᏟᖴᎠs with this provider.
You should consider whether you understand how ᏟᖴᎠs work and whether you can afford to take the high risk of losing your money.
Warning! Old version of the browser!
Press one of the icons below to proceed to the official website of the developer and download the latest version of your browser.

Online Forex broker
2022-08-26 • Updated
Information is not investment advice
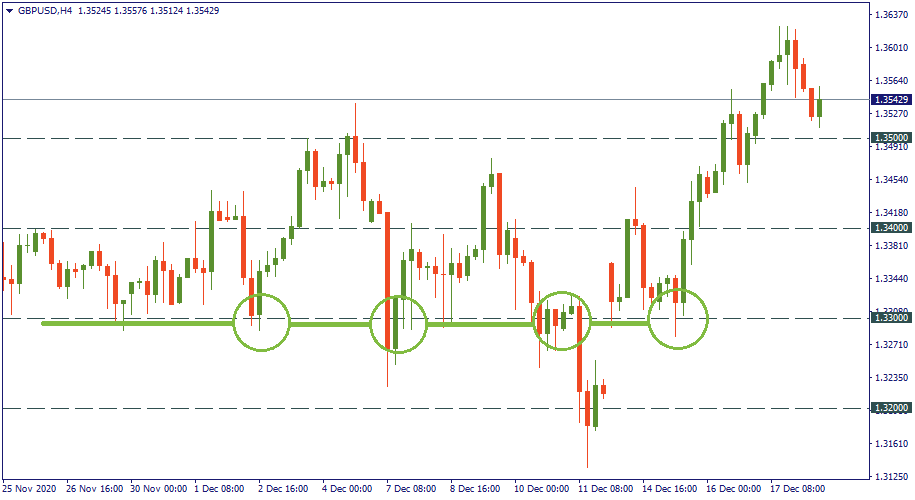
Normally, when we set resistance or support levels, we search for previous lows or highs to do that. For instance, on the H4 chart below, GBP/USD has been revolving around the level of 1.33 for quite a while so it would make sense to choose this level as tactical support. Very convenient, right? Basically, you trade the asset’s past performance.
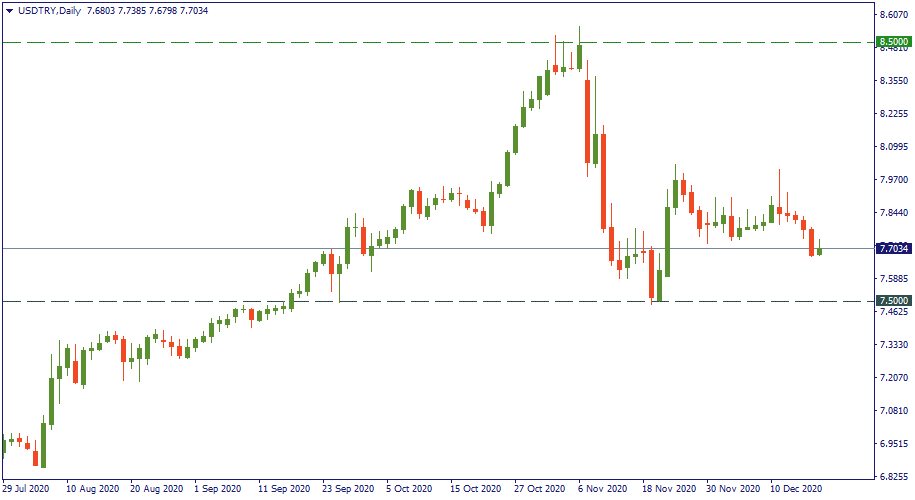
But what if the currency pair reaches a zone where it’s never been before, an uncharted territory? That’s the case for USD/TRY on the daily chart below. While the support of 7.50 and the resistance of 8.50 get set easily, that only may work for local, intraday trading, and only while the currency pair stays below that resistance of 8.50. But what happens when it comes back up to 8.50 and beats it, how do you set resistance levels?
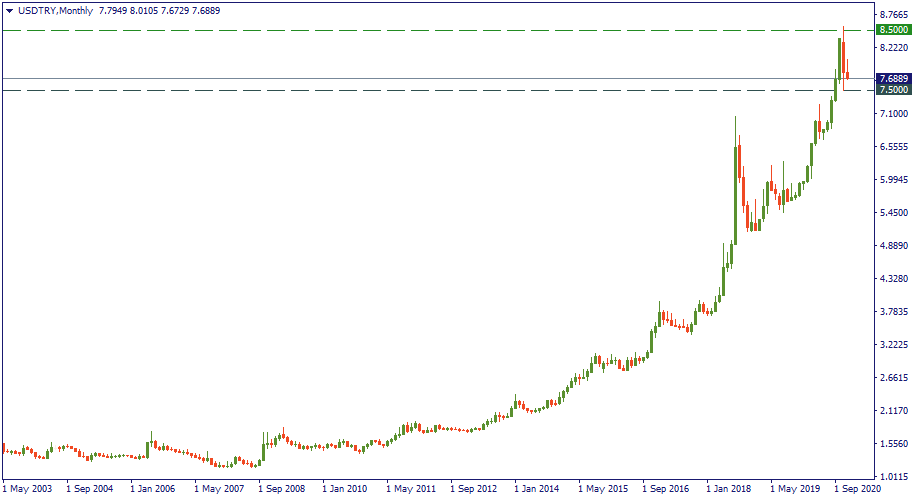
The first thing to check is a larger timeframe. Sometimes, you just don’t see the price performance far enough into the past: a multiyear low or high may hardly be seen on an H4 or daily chart. Therefore, you need to switch to a weekly or monthly timeframe. But for USD/TRY, the monthly chart below shows that in the last twenty years, the price has never come this high. What to do then, and how to set resistance level here?
What you need to do is to make a chart projection. But before you do that, make sure that no change in the fundamental layout is expected for your asset. It’s like planning a sea route: you came to where you are following a certain current. If the wind changes, the current changes – that will take you in an entirely different direction which you cannot plan for. So, you may only foresee your future position assuming that winds keep blowing in the same direction that’s been the case so far.
Now, observe the speed at which your asset has been following its trajectory. You cannot really foresee accelerations or slowdowns, so your only way to project the price movement into the mid-term and long-term future is to assume it keeps the same pace, on average. Once you do that, you’ll have an expected price movement chart plotted on your screen which now may serve you to set appropriate resistance or support levels. Objective complete.
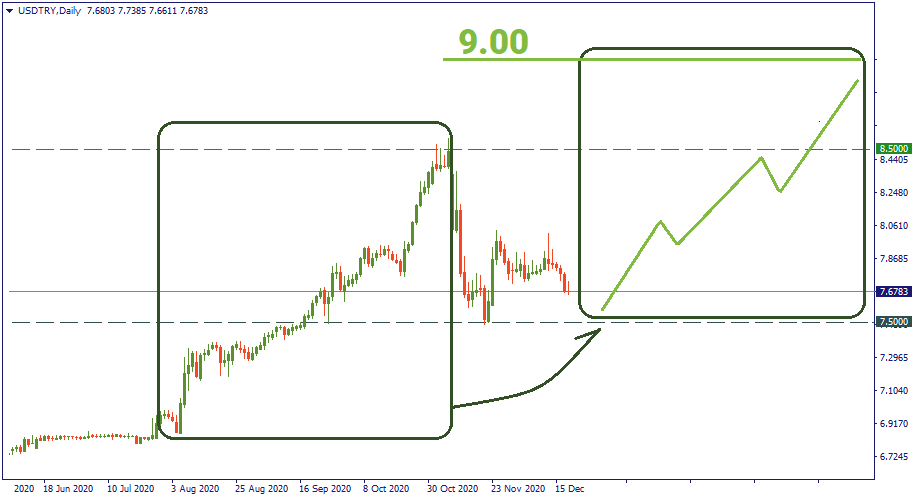
For example, the daily chart of USD/TRY below. We take its upward trajectory marked in the square on the left side as a basis for extrapolation. That is its normal behavior with no major news or big market movement around. Now, we assume that it will be following a similar trajectory in the foreseeable mid-term future. When we plot it, it doesn’t have to be identical: we just make an approximation of what the most possible scenario for USD/TRY is, under the same fundamental conditions. A hypothetical chart that we get suggests that in about three months, USD/TRY may reach 9.00 from 7.50 just as it went from 7.00 to 8.50 in August-October. Congratulations! Now, we are able to set the resistance at 9.00 and base our trade plans accordingly. The same would work with downward movements.
Keep in mind that this approach is more applicable for mid-term and long-term projections. Short-term, intraday movements are much more distorted by temporary market emotions while the long game ignores that noise. Also, note that you have to include approximate corrections and retracements in your projection. Otherwise, you may end up having an ideal scenario or smooth straight curves that give unrealistic price behavior expectations.
So, when you have all-time highs or all-time lows being beaten, and no reference points in the asset’s previous performance seem to be valid, follow these guidelines:

Bill Williams is the creator of some of the most popular market indicators: Awesome Oscillator, Fractals, Alligator, and Gator.

Trend strategies are good - they may give significantly good results in any time frame and with any assets. The main idea of the ADX Trend-Based strategy is to try to catch the beginning of the trend.

Counter-trend strategies are always the most dangerous but also the most profitable. We are pleased to present an excellent counter-trend strategy for working in any market and with any assets.


Your request is accepted.
We will call you at the time interval that you chose
Next callback request for this phone number will be available in 00:30:00
If you have an urgent issue please contact us via
Live chat
Internal error. Please try again later