


Williams’ Strategy
Bill Williams is the creator of some of the most popular market indicators: Awesome Oscillator, Fractals, Alligator, and Gator.

Don’t waste your time – keep track of how NFP affects the US dollar!
Data Collection Notice
We maintain a record of your data to run this website. By clicking the button, you agree to our Privacy Policy.

Beginner Forex Book
Your ultimate guide through the world of trading.

Check Your Inbox!
In our email, you will find the Forex 101 book. Just tap the button to get it!
Risk warning: ᏟᖴᎠs are complex instruments and come with a high risk of losing money rapidly due to leverage.
70.72% of retail investor accounts lose money when trading ᏟᖴᎠs with this provider.
You should consider whether you understand how ᏟᖴᎠs work and whether you can afford to take the high risk of losing your money.
Warning! Old version of the browser!
Press one of the icons below to proceed to the official website of the developer and download the latest version of your browser.

Online Forex broker
2022-08-26 • Updated
Information is not investment advice
“And if they insist on trying to time their participation in equities, they should try to be fearful when others are greedy and greedy only when others are fearful.” — Warren Buffett
In this article, we present an instrument that indicates whether global investors’ mood is either greedy or fearful.
The Fear and Greed Index uses a scale of 0 to 100. The higher the indicator’s value the greedier investors are. On the contrary, low readings of the index mean that investors got cautious or, in other words, market sentiment has become risk-off. The value of 50 means investors are neutral. Historical data says that on March 23, 2020, on the pick of the COVID-19 crisis the Fear and Greed index dropped as low as to 12. If you look at the charts of that period, you will see the bullish spike in such safe-haven assets as the Japanese yen (USD/JPY dropped to a multiyear low). So you can see how the information provided by the Fear and Greed Index can help traders to make the right decisions during periods of high market volatility.
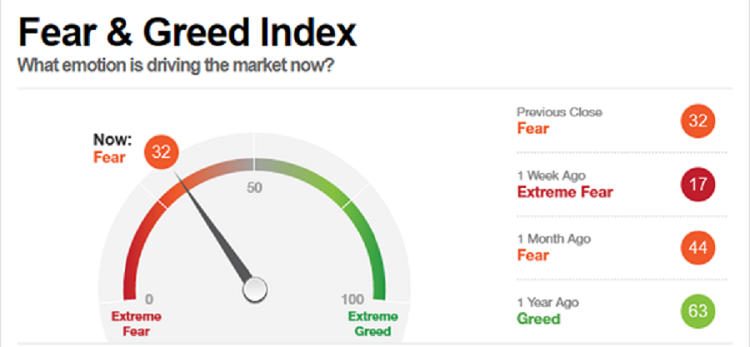
. Source: https://money.cnn.com/
The Fear & Greed index is based on seven different indicators. CNN tracks the difference from its normal value and gives equal weight to each indicator in the final reading.
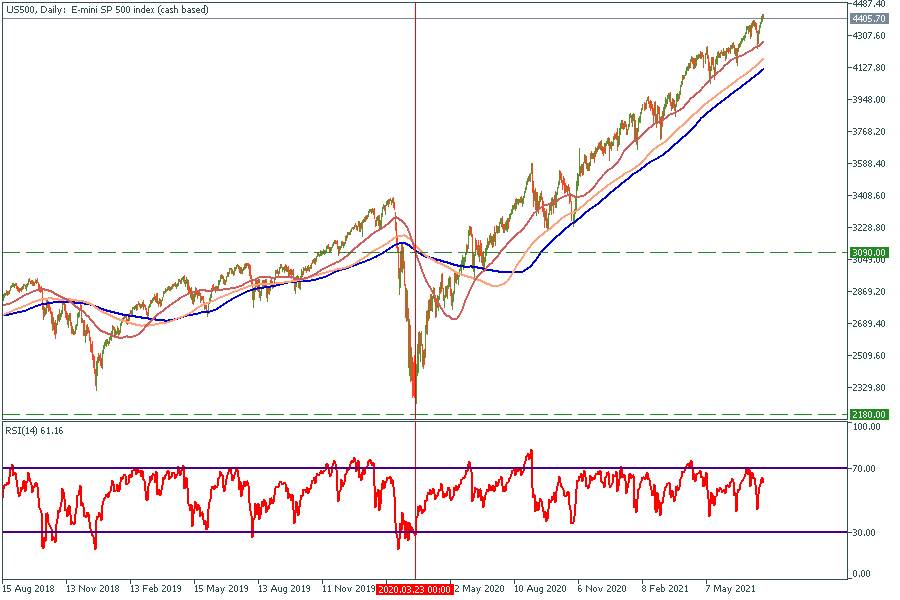
1. Stock Price Momentum. The S&P 500 versus its 125-day moving average. During the COVID-19 bump on March 23 S&P500 index deviated from the 125-day moving average by 900 points, which was the biggest difference since 2008.
2. Stock Price Strength. The number of stocks hitting 52-week highs and lows on the New York Stock Exchange. The bigger number of undervalued or overvalued stocks shows either stock market is oversold or overbought respectively.
3. Stock Price Breadth. The volume of trading in stocks on the rise versus those declining. Usually, the volume rises as the price reaches its top or bottom levels. It happens because whales are gaining or dumping their positions respectively. Market breadth can be used to gauge how widespread bullish or bearish sentiment is.
4. Put and Call Options. The ratio of bullish call options trades versus bearish put options trades. Options give the right not the obligation to buy (call option) or sell (bull option) an asset. Therefore, more trades of puts over calls could indicate investors are feeling pessimistic about share prices in the future, and vice versa bigger number of calls over puts can tell about investors’ optimistic sentiment towards the stock market future.
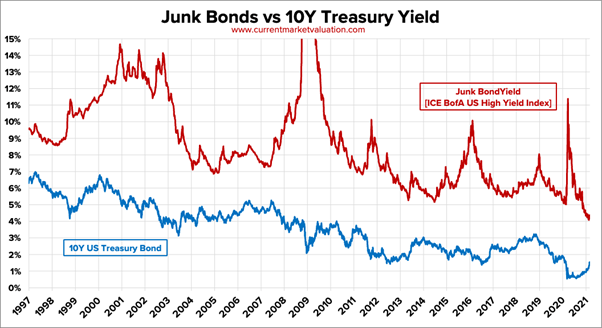
5. Junk Bond Demand. The spread between yields on investment-grade bonds and junk or high-yield bonds. Bond prices move in the opposite direction of yields. During periods of high turbulence, investors prefer to save money, as a result, investment-grade bonds become more expensive while yields decline. Visa versa, crises make investors get rid of riskier assets what makes junk bonds’ prices drop as yields grow.
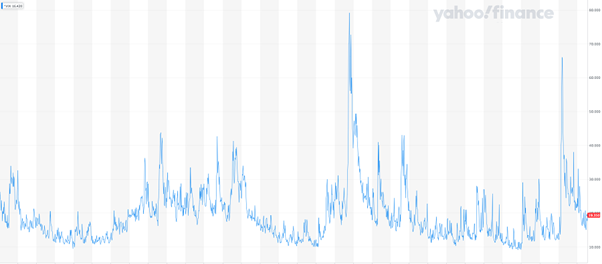
6. Market Volatility. The Cboe Volatility Index, also known as VIX, is designed to track investor expectations for volatility during the next 30. Rising expectations for stock market future turbulence could be a perfect signal of upcoming correction.
7. Safe Haven Demand. The difference in returns from stocks versus Treasures. Investors' preferences towards riskier markets versus safer assets indicate the market’s sentiment.
Fear & Greed index is the best option to use during days of the highest volatility on the market. Use it to determine when to enter the market if you trade S&P 500. When the index gets under 20 during huge it's time to think about opening long positions and visa versa. In addition, the index may tell you the general sentiment of the market risk-on or risk-off. This will help you understand which assets welcome long (buy) trades and which are a better choice for selling.
However, making decisions relying only on Fear & Greed index will be a huge mistake. Extreme bullishness could be caused by the economy’s rising wealth and vice versa, so it is highly important to follow fundamental news as well.
Bill Williams is the creator of some of the most popular market indicators: Awesome Oscillator, Fractals, Alligator, and Gator.

Trend strategies are good - they may give significantly good results in any time frame and with any assets. The main idea of the ADX Trend-Based strategy is to try to catch the beginning of the trend.

Counter-trend strategies are always the most dangerous but also the most profitable. We are pleased to present an excellent counter-trend strategy for working in any market and with any assets.


Your request is accepted.
We will call you at the time interval that you chose
Next callback request for this phone number will be available in 00:30:00
If you have an urgent issue please contact us via
Live chat
Internal error. Please try again later