


Williams’ Strategy
Bill Williams is the creator of some of the most popular market indicators: Awesome Oscillator, Fractals, Alligator, and Gator.

Don’t waste your time – keep track of how NFP affects the US dollar!
Data Collection Notice
We maintain a record of your data to run this website. By clicking the button, you agree to our Privacy Policy.

Beginner Forex Book
Your ultimate guide through the world of trading.

Check Your Inbox!
In our email, you will find the Forex 101 book. Just tap the button to get it!
Risk warning: ᏟᖴᎠs are complex instruments and come with a high risk of losing money rapidly due to leverage.
66.43% of retail investor accounts lose money when trading ᏟᖴᎠs with this provider.
You should consider whether you understand how ᏟᖴᎠs work and whether you can afford to take the high risk of losing your money.
Warning! Old version of the browser!
Press one of the icons below to proceed to the official website of the developer and download the latest version of your browser.

Online Forex broker
2024-03-26 • Updated
Information is not investment advice
Every trader needs to have a trading system. It is a set of rules you follow before, in, and after every trade. One of the critical parts of the trading system is a reason for you to enter or exit the trade. In this article, we will guide you through these reasons.
Chart patterns are on one side, and candlesticks are on the other. Who will win?
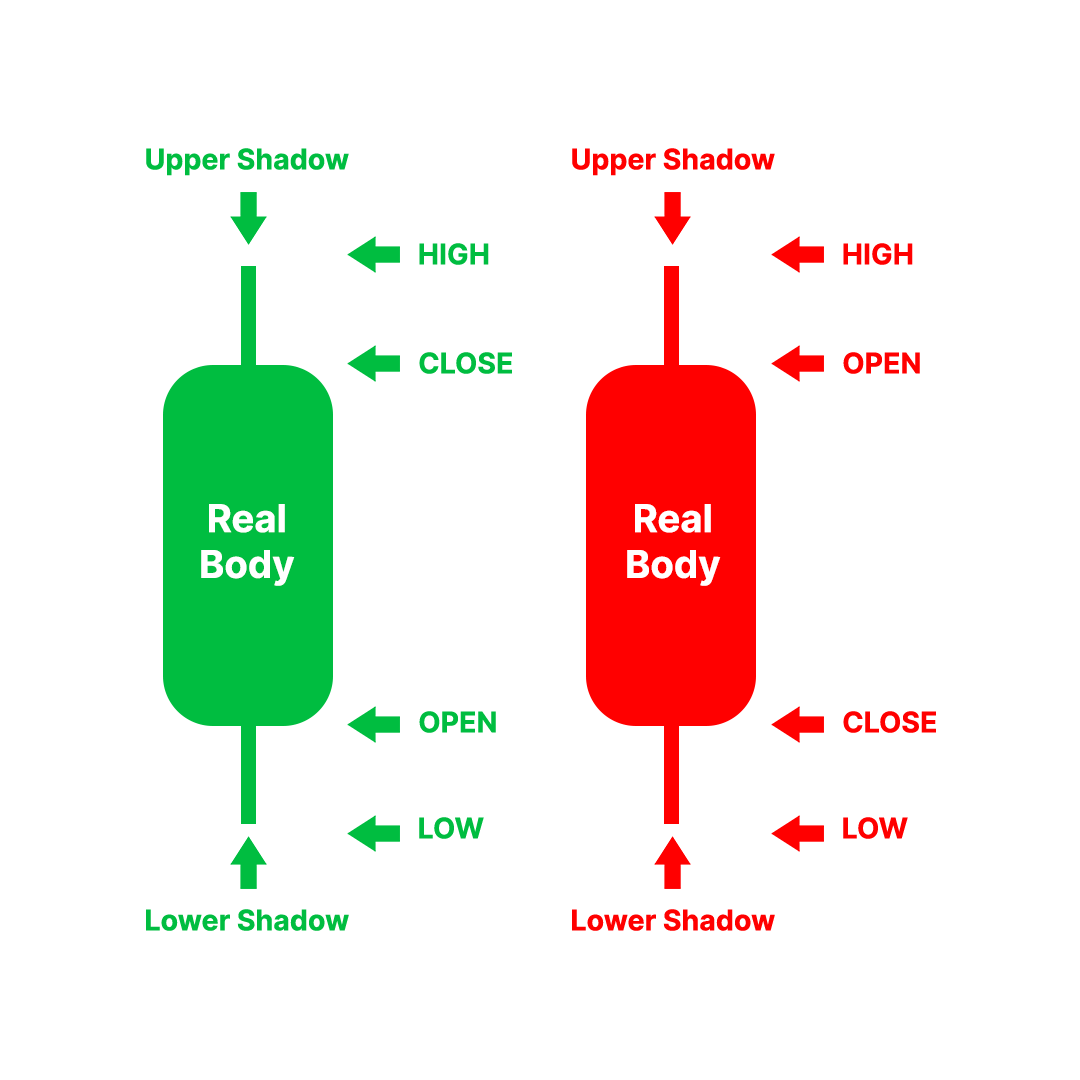
Every candle consists of several parts. It has a real body and two shadows. Thanks to the Japanese candlesticks, we can read the market movements, including the price at the beginning and the end of every trading period. Read more in the complete Japanese candlesticks guide. Let’s now look at different candlestick patterns.
Hammer is a bullish candlestick pattern that indicates a potential trend reversal. The pattern consists of a candle with a small body and a long lower shadow, suggesting that buyers could push the price up after a period of selling pressure.
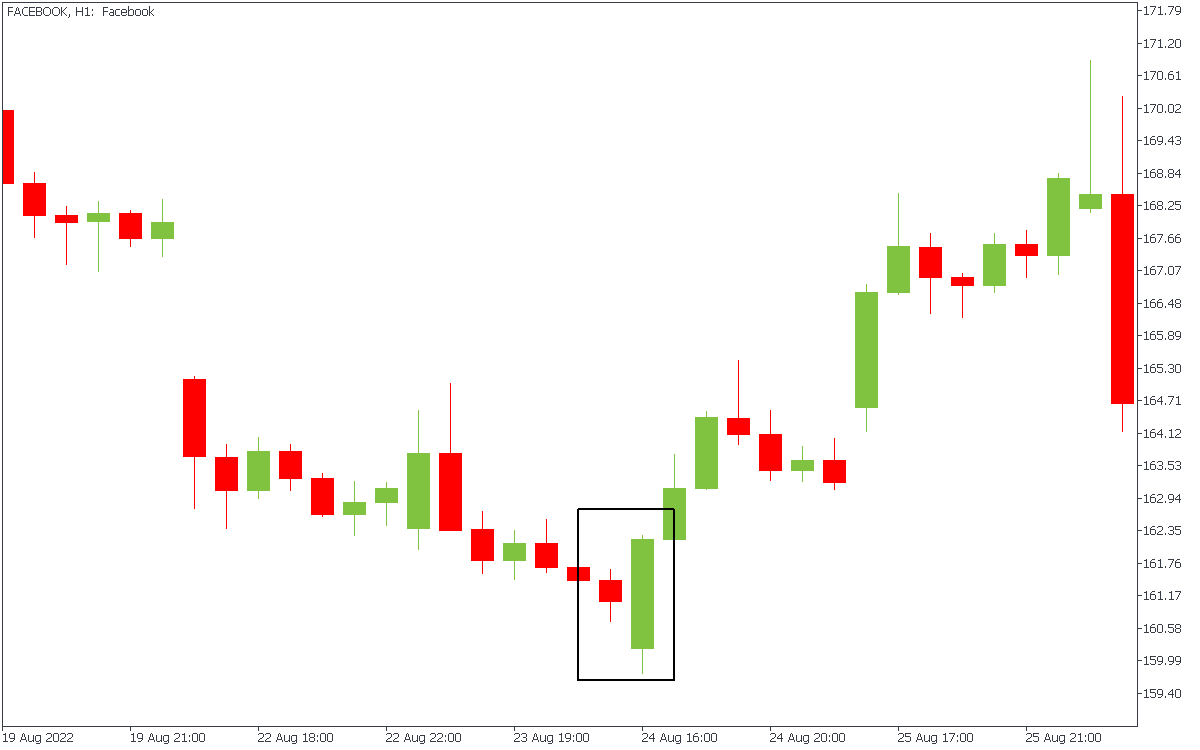
This bullish reversal pattern occurs when a larger green candlestick completely engulfs a small red candlestick. The second candle should start below the shadow of the first one and end above its highest point. The pattern tells us that buyers took control of the market.
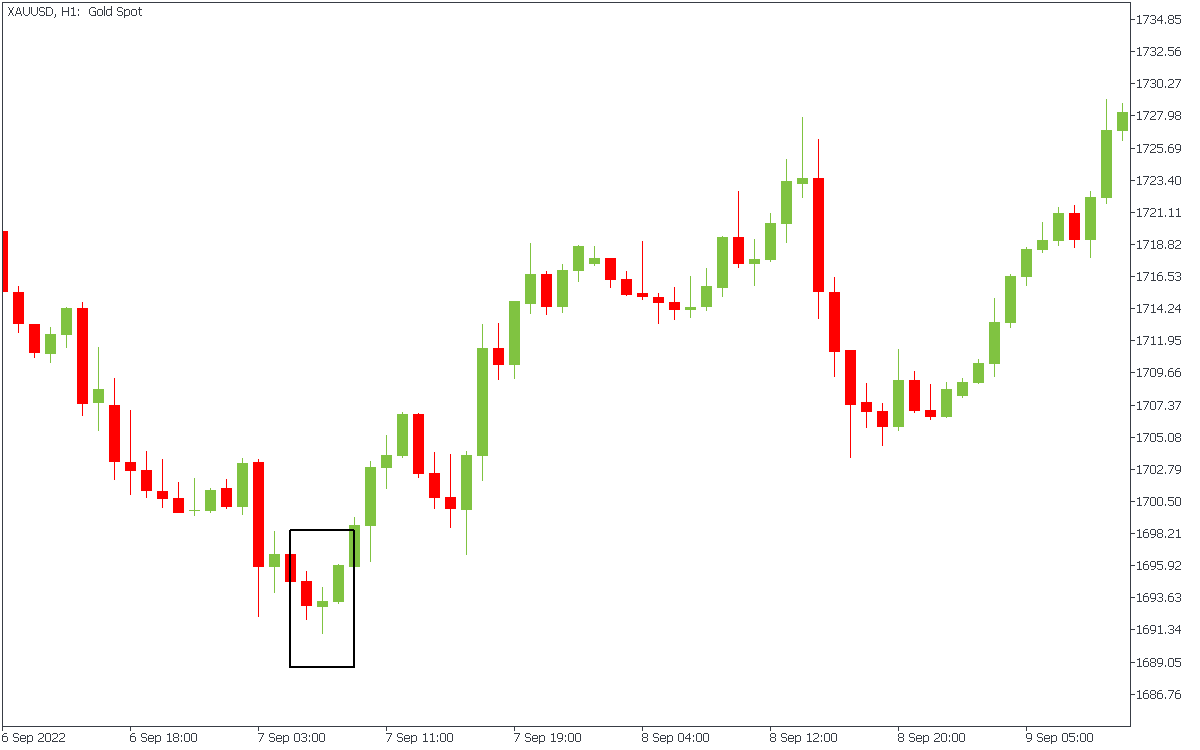
Morning Star is a bullish reversal pattern consisting of three candles. The first is a long bearish candle, followed by a small candlestick, and then a long bullish candle. The pattern suggests that a trend reversal is imminent. Note that the middle candle usually has short bodies and shadows, showing that bulls and bears failed to push the price.
Also, traders watch for gaps in price to confirm the pattern.
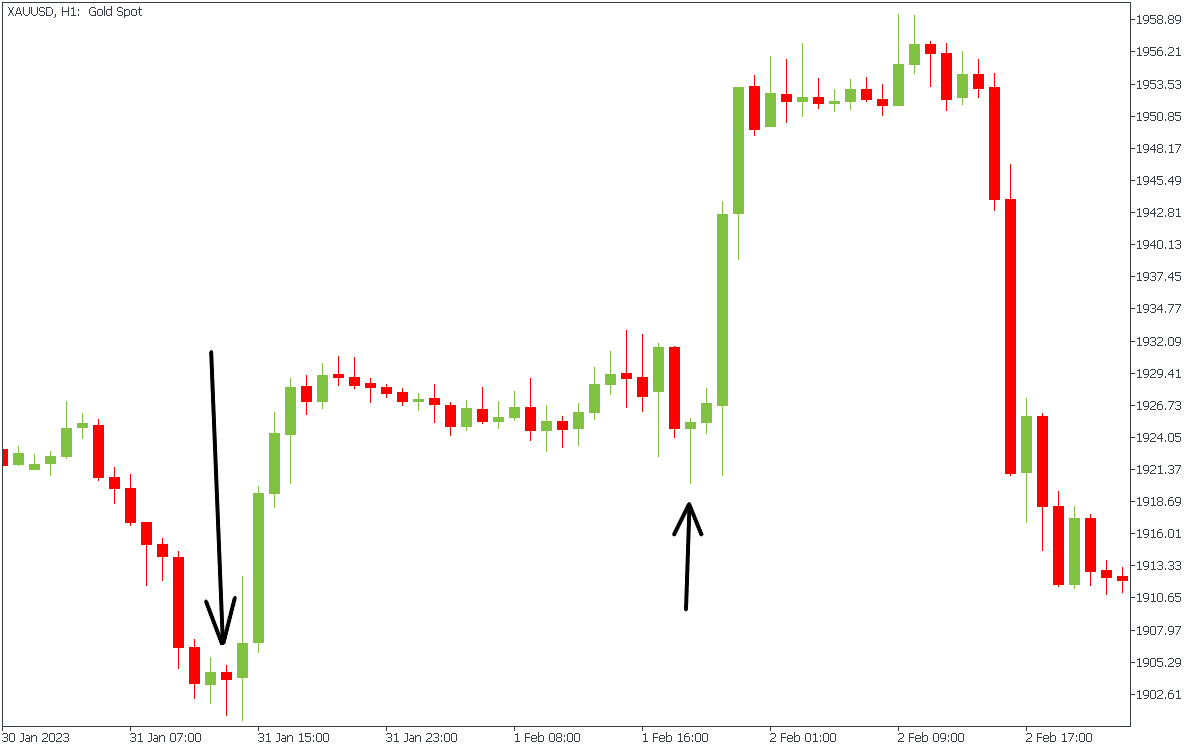
This is a bearish reversal pattern at the top of an uptrend. The candle has a small body and a long lower shadow, suggesting buyers could not sustain the upward momentum.
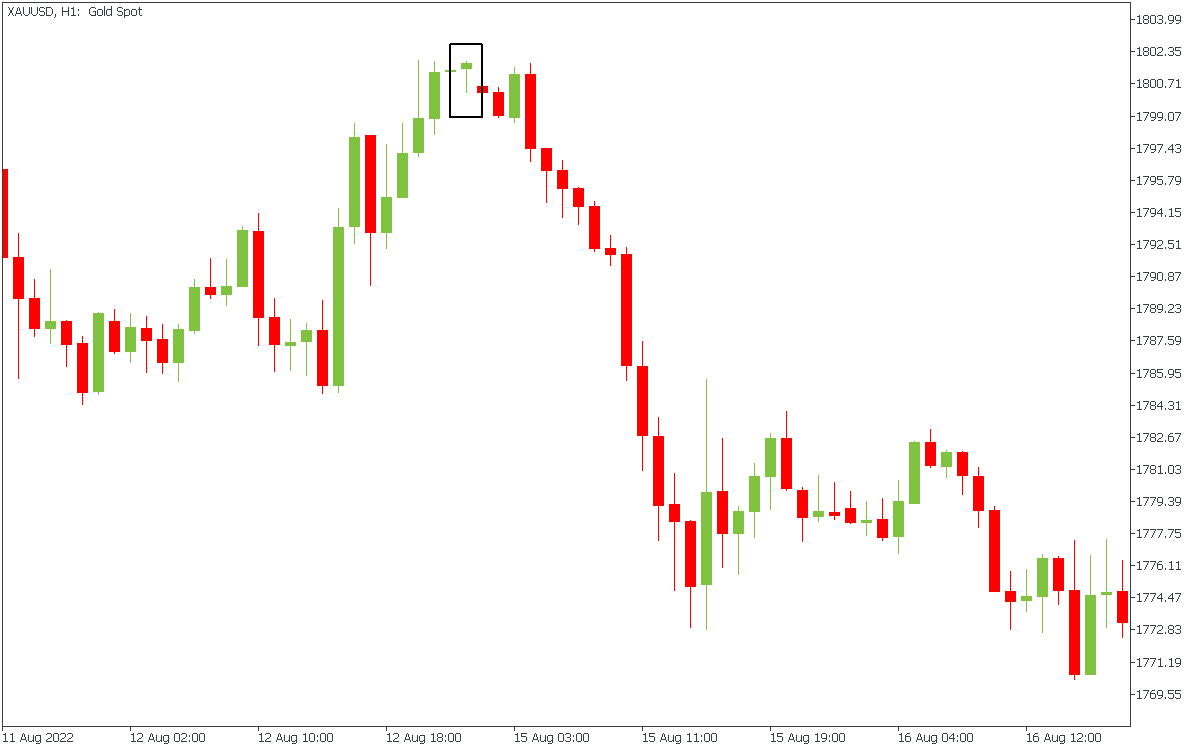
This reversal pattern occurs at the top of a movement. The pattern is characterized by a small body and a long upper shadow, suggesting that sellers could push the price down after a period of buying pressure.
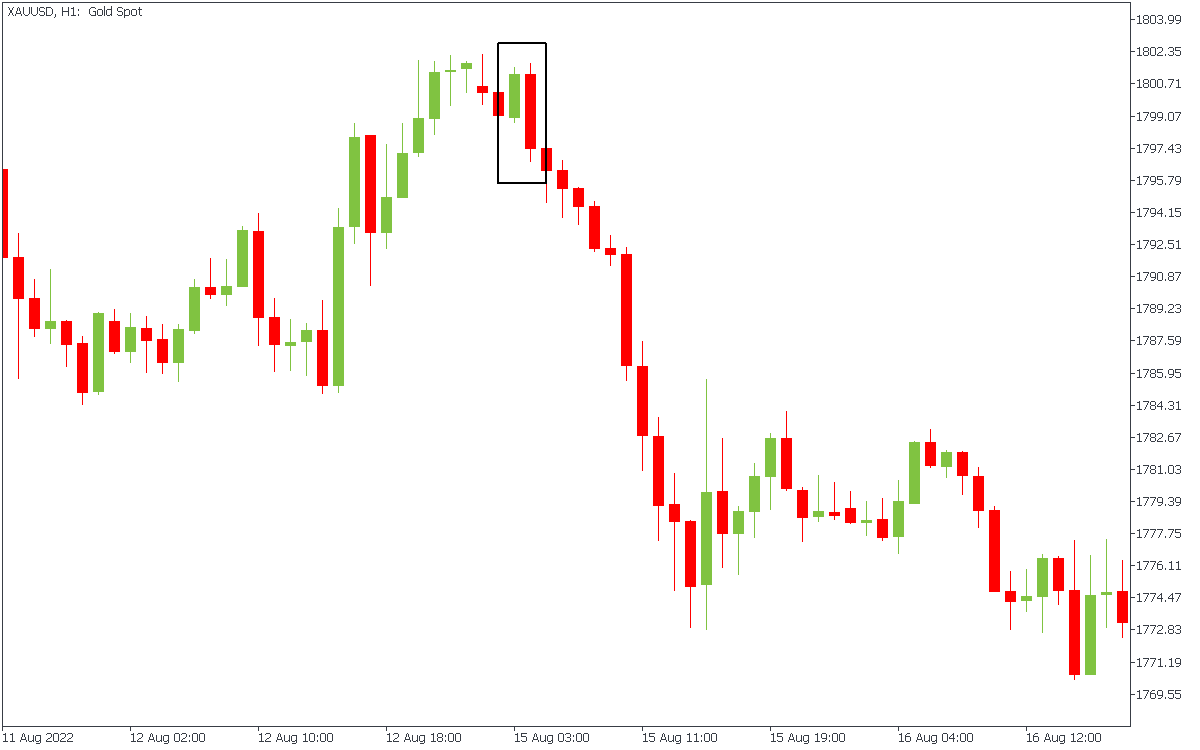
A bearish reversal pattern occurs when a larger red candlestick completely engulfs a small green candlestick. It looks entirely like a bullish engulfing pattern with the candles switched. The first is a green candle, and the second is red. Usually, sellers enter the game after the bearish engulfing pattern finishes.
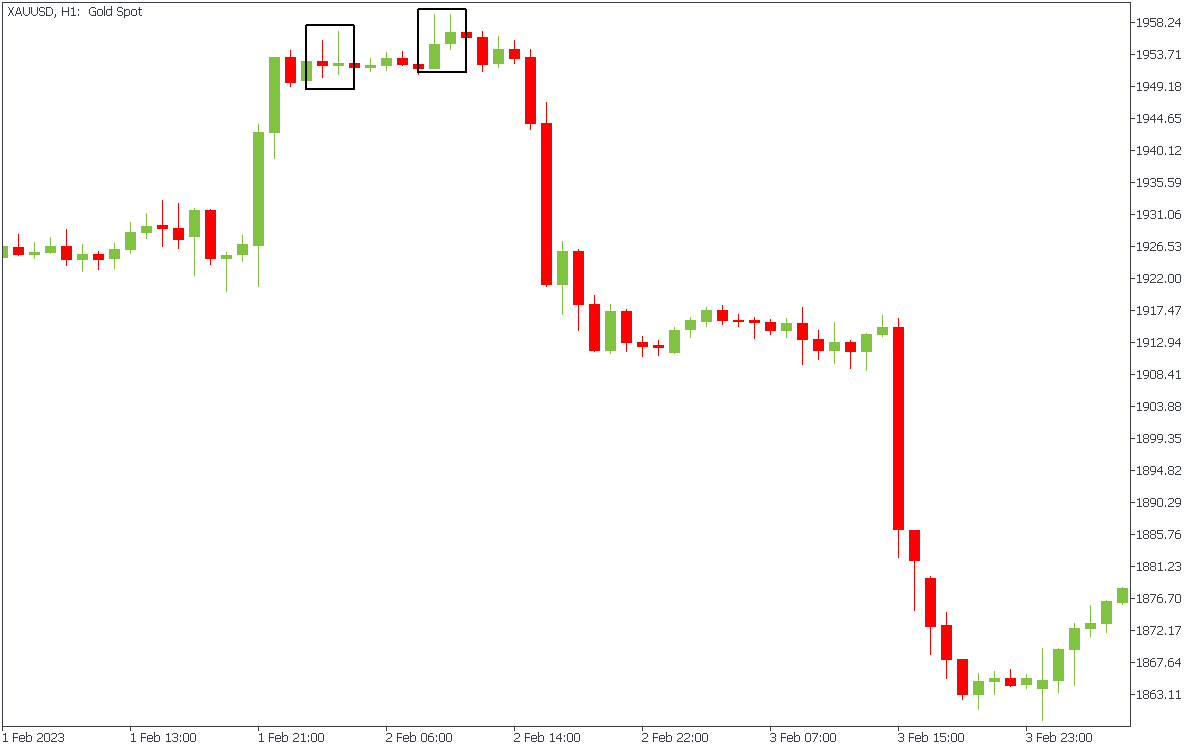
It is way more efficient when you see several reversal candlestick patterns in a row. For example, in the figure above, the bearish engulfing appeared after two shooting stars, confirming the upcoming downtrend.
Unlike candlestick patterns, chart patterns take more time to form. For example, when bearish engulfing occurs, you need only two candles to assess the situation. On the other hand, a chart pattern takes at least ten candles. Here, we collected different chart patterns for you.
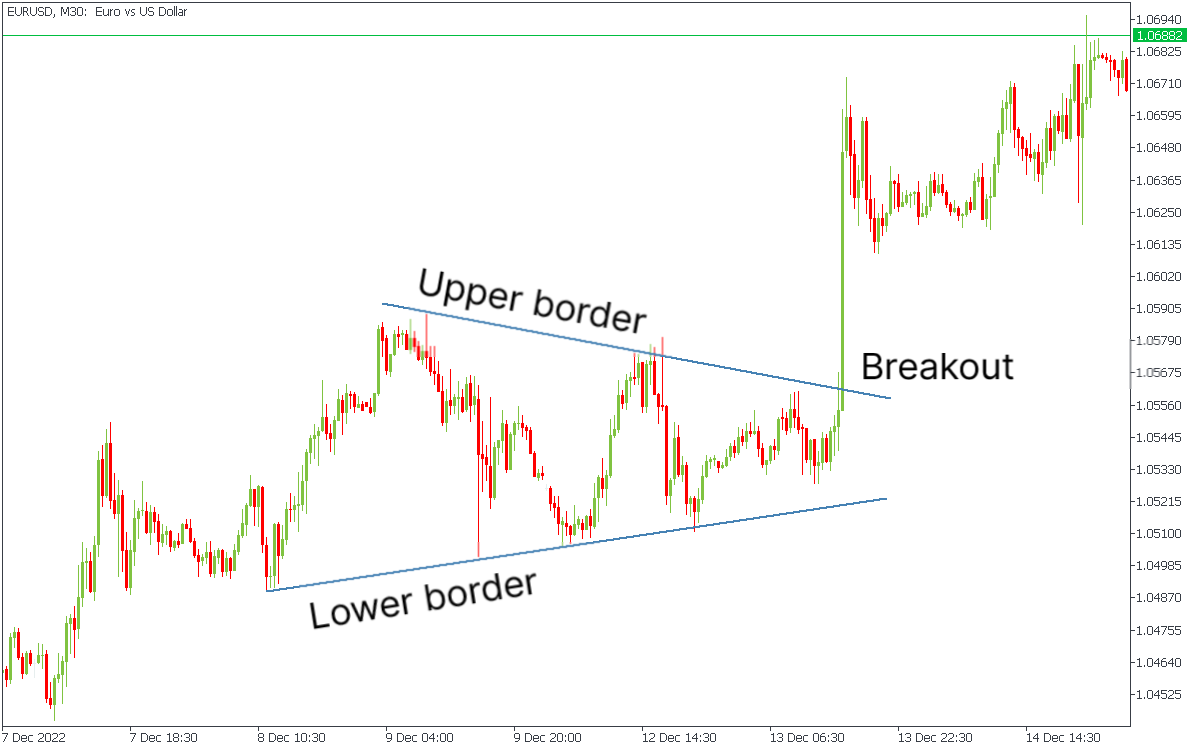
This is a continuation pattern that forms when the price movements are contained within two converging trend lines. A breakout in either direction suggests a continuation of the prior trend. There are three types of triangles:
On the chart below, you can see a symmetrical triangle.
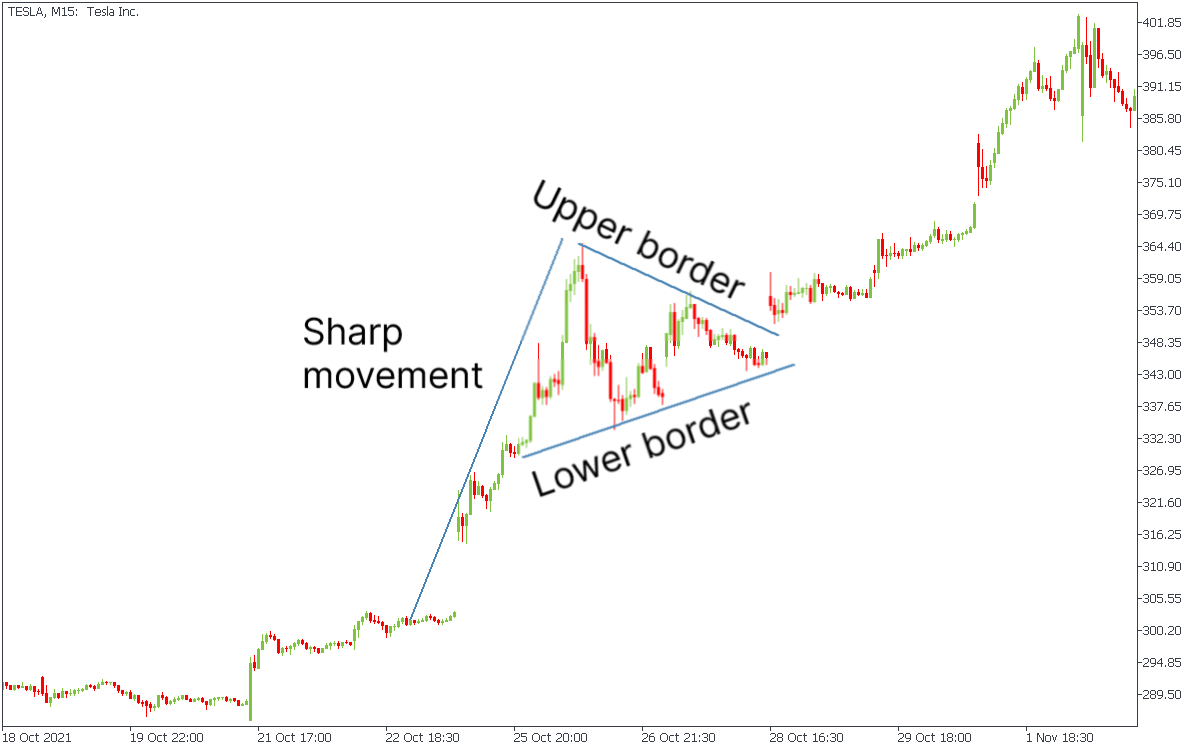
This continuation pattern forms when a brief period of consolidation follows a sharp price movement. It resembles a small symmetrical triangle and suggests that the prior trend will continue.
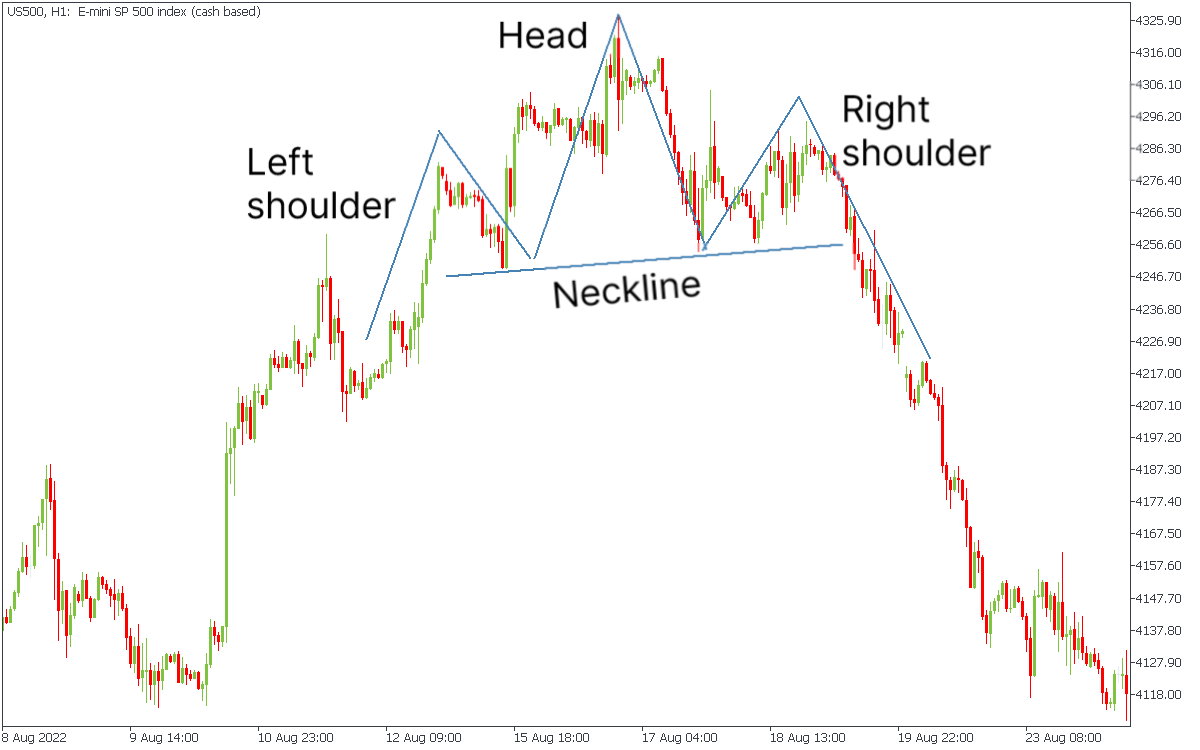
This is a reversal pattern that consists of three peaks, with the middle peak being the highest. The pattern suggests that the market is shifting from an uptrend to a downtrend.
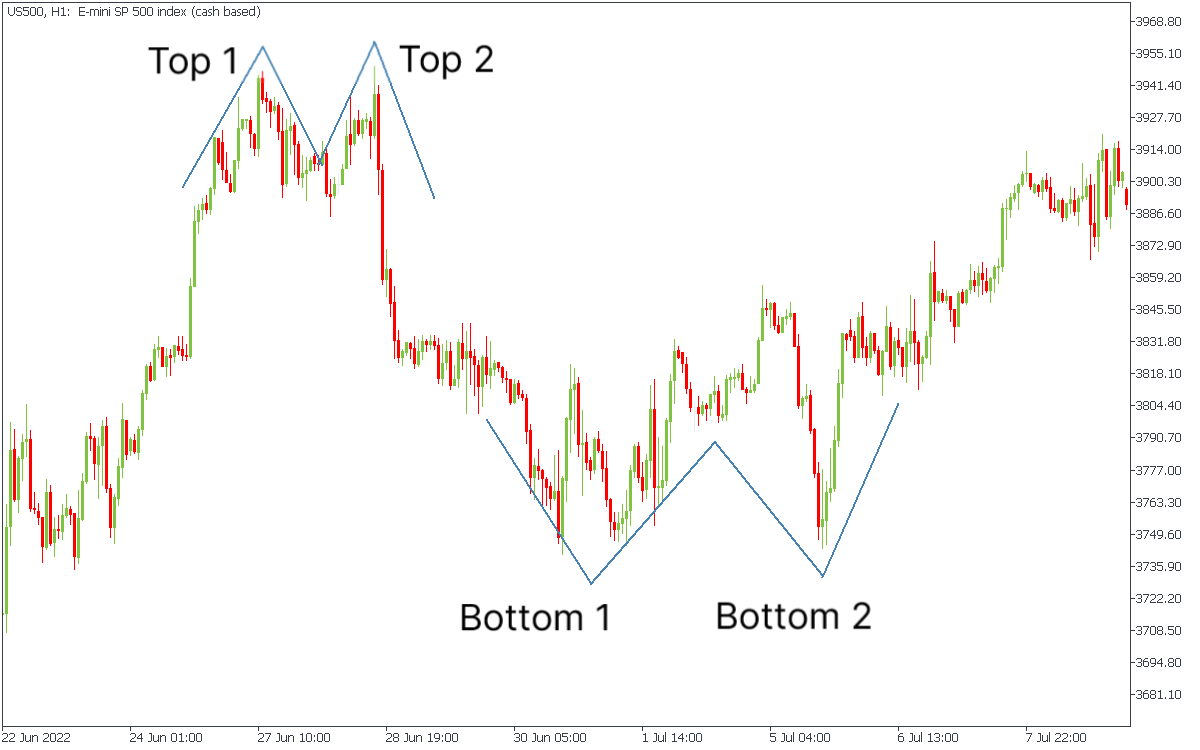
These patterns occur when the price reaches a high or low point twice, with a period of decline or rise in between. A double top or a double bottom suggests that the market may reverse.
Here are the main differences between chart patterns and candlesticks:
In conclusion, chart patterns and candlesticks are valuable tools for traders to analyze and predict market movements. It is essential to have a trading system and an apparent reason for entering or exiting a trade, whether based on chart patterns, candlesticks, or both. Ultimately, choosing between chart patterns and candlesticks comes down to personal preference and trading strategy.
Legal disclaimer: The content of this material is a marketing communication, and not independent investment advice or research. The material is provided as general market information and/or market commentary. Nothing in this material is or should be considered to be legal, financial, investment or other advice on which reliance should be placed. No opinion included in the material constitutes a recommendation by Tradestone Ltd or the author that any particular investment security, transaction or investment strategy is suitable for any specific person. All information is indicative and subject to change without notice and may be out of date at any given time. Neither Tradestone Ltd nor the author of this material shall be responsible for any loss you may incur, either directly or indirectly, arising from any investment based on any information contained herein. You should always seek independent advice suitable to your needs.

Bill Williams is the creator of some of the most popular market indicators: Awesome Oscillator, Fractals, Alligator, and Gator.

Trend strategies are good - they may give significantly good results in any time frame and with any assets. The main idea of the ADX Trend-Based strategy is to try to catch the beginning of the trend.

Counter-trend strategies are always the most dangerous but also the most profitable. We are pleased to present an excellent counter-trend strategy for working in any market and with any assets.


Your request is accepted.
We will call you at the time interval that you chose
Next callback request for this phone number will be available in 00:30:00
If you have an urgent issue please contact us via
Live chat
Internal error. Please try again later