


Williams’ Strategy
Bill Williams is the creator of some of the most popular market indicators: Awesome Oscillator, Fractals, Alligator, and Gator.

Don’t waste your time – keep track of how NFP affects the US dollar!
Data Collection Notice
We maintain a record of your data to run this website. By clicking the button, you agree to our Privacy Policy.

Beginner Forex Book
Your ultimate guide through the world of trading.

Check Your Inbox!
In our email, you will find the Forex 101 book. Just tap the button to get it!
Risk warning: ᏟᖴᎠs are complex instruments and come with a high risk of losing money rapidly due to leverage.
70.72% of retail investor accounts lose money when trading ᏟᖴᎠs with this provider.
You should consider whether you understand how ᏟᖴᎠs work and whether you can afford to take the high risk of losing your money.
Warning! Old version of the browser!
Press one of the icons below to proceed to the official website of the developer and download the latest version of your browser.

Online Forex broker
2022-08-26 • Updated
Information is not investment advice
We all know how you love scalping, right? This trading approach helps you to take advantage out of trading on small (less than 1 hour) timeframes. In this article, we will introduce you to another scalping strategy that requires the usage of the Bollinger Bands indicator.
Timeframe: M5
Currency pairs: GBP/USD, EUR/USD
Indicators: Bollinger Bands with the following settings: a period of 20, 2 standard deviations; Stochastic Oscillator with standard settings (14, 5, 3) as a filter.
The whole strategy is based on finding a flat Bollinger band. That means, we are looking for a flat market situation, where the price does not make new highs or lows. It is recommended to trade this strategy during the early morning hours or at night when Europe is still asleep and volatility is low. The trading algorithm is very simple. You just need to follow the steps explained below.
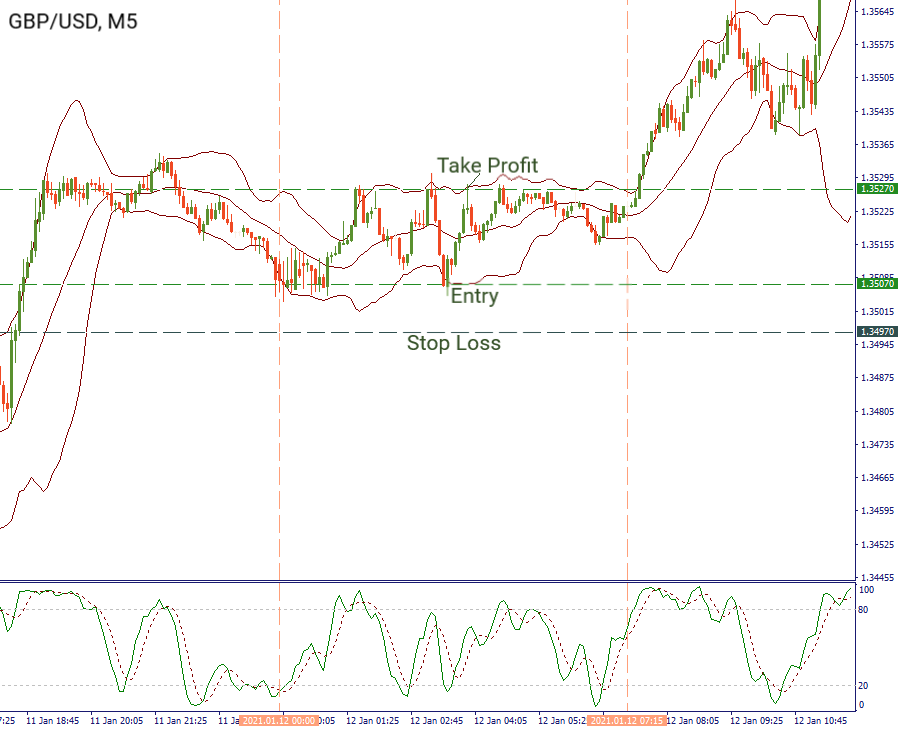
1. Open a long position when the price touches a lower Bollinger band and the stochastic oscillator is in the oversold zone.
2. You can place a Stop Loss 10 pips below the level where you placed an order.
If you think that this Stop Loss is too risky for your trading approach, you can calculate a distance between the middle and the lower Bollinger band. The wider the range between Bollinger bands, the bigger will be your stop loss.
3. Close your position when the price touches an upper Bollinger band.
Let’s consider an example of GBP/USD. The pair was trading sideways on January 12, between 00:00-07:15 MT time. When the price touched the lower Bollinger band, we looked at the Stochastic Oscillator. At that time, it entered the oversold zone. We opened a long position at 1.3507. We placed a Stop Loss 10 pips below the entry at 1.3497. Take Profit was located at the upper Bollinger band at 1.3527. We successfully earned 20 pips!
An algorithm for sellers is exactly opposite.
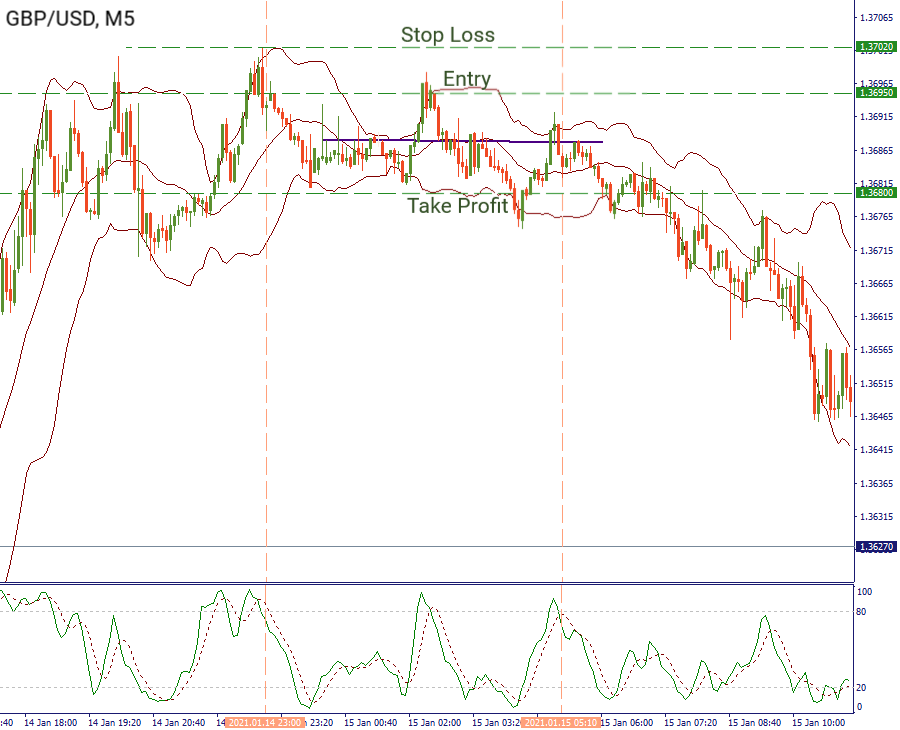
1. Place a short order when the price touches an upper Bollinger band and the Stochastic Oscillator is in the overbought zone.
2. Place Stop Loss 10 pips above the level where you placed an order.
Another option of placing a stop loss: calculate a distance between the upper and the middle Bollinger bands. Sum the result with your entry level. Place your Stop Loss at the level you get.
3. Close your position when the price touches a lower Bollinger band.
As an example of this strategy, we will look once again at the M5 chart of GBP/USD. On January 14, somewhere between 23:00 and 05:00 MT time the cable was consolidating. We waited when the price touched the upper Bollinger band and the Stochastic Oscillator reached an overbought zone. We opened a short position at 1.3695. This time, we tried another calculation of stop loss. Firstly, we calculated the distance between our entry and the middle Bollinger band (1.3695-1.3688=0.0007). Therefore, our Stop Loss goes 7 pips above the entry level (1.3702). Take Profit goes at 1.3680 (where the price touches the lower Bollinger band). As a result, we earned 15 pips.
The strategy we explained above has several main advantages for you. First of all, it is very easy to implement and it requires only two oscillators. Secondly, it allows you to trade during "sleepy markets" when the volatility is low and you don't know what to do. Finally, it’s scalping, beloved by literally everyone! So, why not give it a try?

Bill Williams is the creator of some of the most popular market indicators: Awesome Oscillator, Fractals, Alligator, and Gator.

Trend strategies are good - they may give significantly good results in any time frame and with any assets. The main idea of the ADX Trend-Based strategy is to try to catch the beginning of the trend.

Counter-trend strategies are always the most dangerous but also the most profitable. We are pleased to present an excellent counter-trend strategy for working in any market and with any assets.


Your request is accepted.
We will call you at the time interval that you chose
Next callback request for this phone number will be available in 00:30:00
If you have an urgent issue please contact us via
Live chat
Internal error. Please try again later