


Williams’ Strategy
Bill Williams is the creator of some of the most popular market indicators: Awesome Oscillator, Fractals, Alligator, and Gator.

Don’t waste your time – keep track of how NFP affects the US dollar!
Data Collection Notice
We maintain a record of your data to run this website. By clicking the button, you agree to our Privacy Policy.

Join Us on Facebook
Stay on top of company updates, trading news, and so much more!
Thanks, I already follow your page!
Beginner Forex Book
Your ultimate guide through the world of trading.

Check Your Inbox!
In our email, you will find the Forex 101 book. Just tap the button to get it!
Risk warning: ᏟᖴᎠs are complex instruments and come with a high risk of losing money rapidly due to leverage.
69.21% of retail investor accounts lose money when trading ᏟᖴᎠs with this provider.
You should consider whether you understand how ᏟᖴᎠs work and whether you can afford to take the high risk of losing your money.
Warning! Old version of the browser!
Press one of the icons below to proceed to the official website of the developer and download the latest version of your browser.

Online Forex broker
Information is not investment advice
Today we are going to explain another strategy, which fits for the trading of majors. It is called multi majors strategy because you do not need to adapt it specifically to each pair. It works perfectly with them and provides you more signals compared to other strategies. Let’s consider what you need to implement to start taking advantage of this strategy. The strategy requires the usage of the following indicators:
• Heiken Ashi. Read about the indicator here.
• RSI with the period which equals 3.
• Stochastic indicator with the following settings: %K period=6, %D period=3 and Slowing=3
• Smoothed moving average with the 150 period.
You can implement the strategy while trading all of the majors and popular crosses on H4 or D1 timeframes.
The price should be placed above the smoothed moving average.
RSI leaves the oversold zone (crosses the 20 level from bottom to top).
One of the lines of the stochastic indicator leaves the oversold zone. Note, that the signals on both RSI and Stochastic indicator may not appear at the same time, as stochastic indicator usually comes later. You may take into account these signals as well. However, it is important for RSI not to enter the overbought zone when the signal on the stochastic appears.
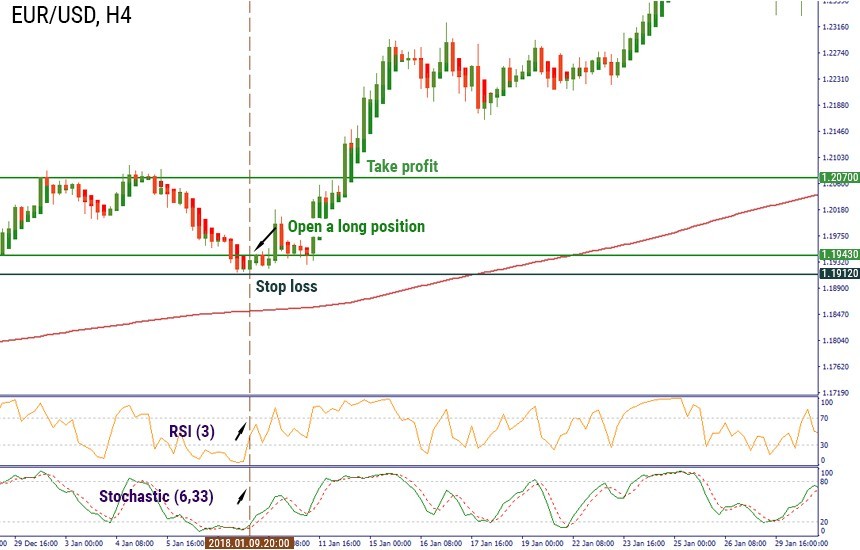
The example below illustrates how to apply the strategy on practice.
On H4 timeframe of EUR/USD, the chart was placed above the smoothed moving average. Both RSI and Stochastic indicators left the oversold zone on January 9. We waited for the candlestick for the price to break the previous resistance and opened a position at 1.1943 (closing price of the green candlestick). We place our stop loss below the previous low at 1.1912. Our take profit is placed at the previous resistance level at 1.2070. As a result, with a risk of 31 pips, we earned 127.
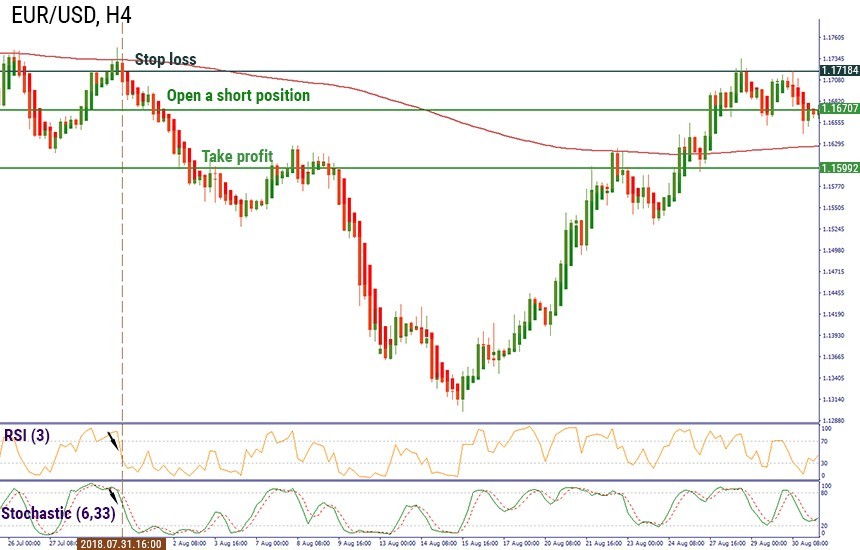
On H4 chart of EUR/USD, the price was moving below the smoothed moving average on July 31, 2018. After RSI and Stochastic oscillators crossed the overbought zone, we waited for the price to break below the previous support and opened a position at 1.1671. Our stop loss is placed above the previous resistance at 1.1718. Take profit is placed at the 1.1599 support level. Thus, we earned 72 pips with a risk of 47 pips.
Multi majors trading strategy helps you to trade more pairs without additional implementations. We can mention only one disadvantage of this strategy. This is the inability to adapt it to the specific features of a pair you trade.

Bill Williams is the creator of some of the most popular market indicators: Awesome Oscillator, Fractals, Alligator, and Gator.

Trend strategies are good - they may give significantly good results in any time frame and with any assets. The main idea of the ADX Trend-Based strategy is to try to catch the beginning of the trend.

Counter-trend strategies are always the most dangerous but also the most profitable. We are pleased to present an excellent counter-trend strategy for working in any market and with any assets.

eurusd-is-falling-what-to-expect-from-the-future-price-movement

Greetings, fellow forex traders! Exciting news for those with an eye on the Australian market - the upcoming interest rate decision could be good news for Aussies looking to refinance or take out new loans. The Mortgage and Finance Association Australia CEO, Anja Pannek, has...

Hold onto your hats, folks! The Japanese yen took a nosedive after the Bank of Japan (BOJ) left its ultra-loose policy settings unchanged, including its closely watched yield curve control (YCC) policy. But wait, there's more! The BOJ also removed its forward guidance, which had previously pledged to keep interest rates at current or lower levels. So, what's the scoop? Market expectations had been subdued going into the meeting, but some were still hoping for tweaks to the forward guidance to prepare for an eventual exit from the bank's massive stimulus


Your request is accepted.
We will call you at the time interval that you chose
Next callback request for this phone number will be available in 00:30:00
If you have an urgent issue please contact us via
Live chat
Internal error. Please try again later