


Why Do Traders Need Technical Analysis?

Since opening a trading account, every trader has one question in mind: where will the stock price move? Will it go up, down, or stay in place? The answer to this question is given by market analysis. There are two types of analysis: fundamental and technical. This article will consider technical analysis in detail and explore how to apply it to stock trading.
What is technical analysis?
Technical analysis studies the price history of a market to predict the future using various tools. That is how traders determine when to buy or sell assets on the exchange. They evaluate not stocks and issuers but price movements.
Fundamental vs technical analysis: fundamental analysis predicts price behaviour based on economic events, while technical analysis focuses on past price behaviour.
Let's talk about the basic rules followed by the technical analysis proponents.
1. Market action discounts everything.
Technical analysts believe that all factors that affect price are already factored into supply and demand. Therefore, they do not care what caused the price to rise or fall; only the change in price itself is important.
2. Price moves in trends.
Price does not move chaotically but follows specific patterns. This means that trends can be identified, described, and thus used in trading. The trader needs to recognize the trend and join it in time.
3. History tends to repeat itself.
People tend to behave similarly in certain situations, so history repeats itself. The rules that were in effect in the past may work in the present and future.
Why does technical analysis work?
The technical analysis tools measure the price movements using mathematical formulas so that you can be sure of their objectivity. In addition, technical analysis considers the psychology and emotions of market participants.
Also, technical analysis disciplines traders: they buy or sell only after signals. Signals appear based on the analysis of supply and demand on which prices depend.
If you are unsure of your stock trading skills, look for information on technical analysis for beginners.
How to do technical analysis
Based on the main principles that form the technical analysis, there are several ways to work with it. The flow of data on exchange transactions can be represented in the form of a price chart. That is a time-varying line, each point of which reflects information about the price and time of each transaction.
Here are some of the methods of technical analysis.
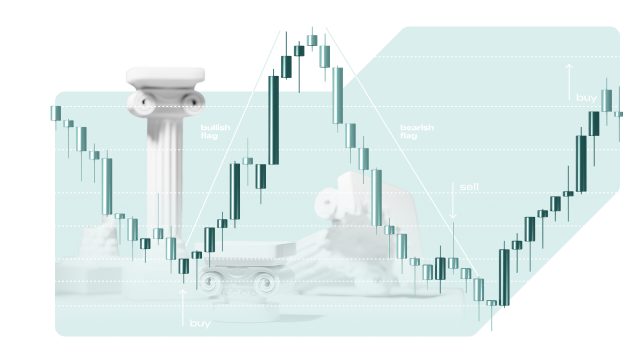
Classic analysis
The essence of the method is to draw lines on the price chart, which form trends and show the direction of price changes as well as price levels, which show the areas of maximum involvement of traders and figures. They characterize the possible options for continuation, uncertainty, or reversal of the existing trend.
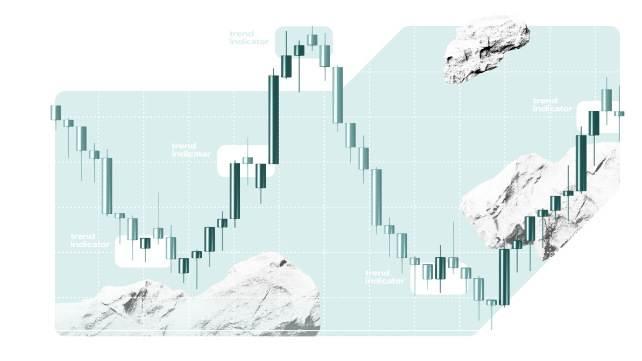
Indicator analysis
This method of technical analysis includes mathematical functions, which are divided into trend indicators and counter-trend oscillators.
Trend indicators include various models showing the direction of the main trend smoothed from the chaos of price fluctuations. Oscillators include mathematical methods for determining both unreasonably high (overbought) and unreasonably low (oversold) prices relative to previous ranges of motion.
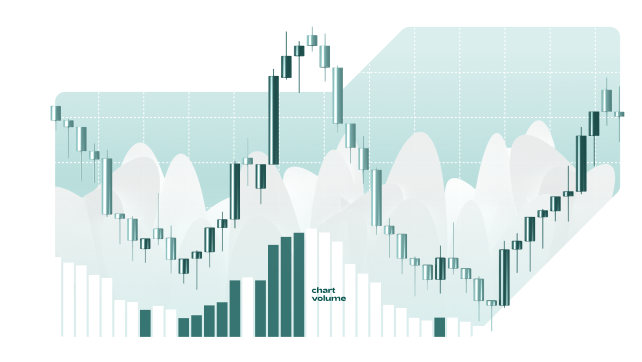
Volume analysis
The technical analysis of the current financial market situation is based on volume (number of open positions) during a particular period. Analysts have long noticed a correlation: price changes occur during periods of high volume. The higher the volume in a particular time frame, the more likely a price movement is true, and the trend is likely to continue in the same direction. Volumes also oscillate, so there is usually a rise in volumes after the calm periods.
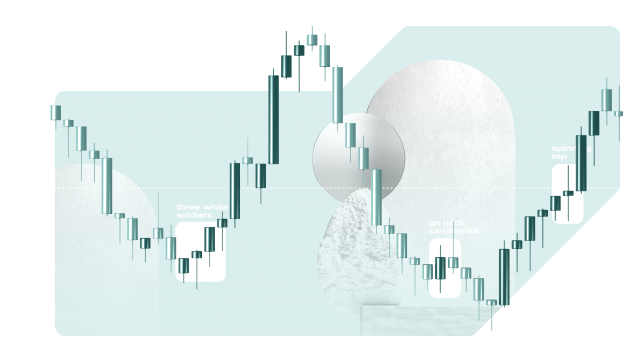
Candlestick analysis
This type of technical analysis uses single or multiple candlestick patterns to analyze what is happening in the financial market. Candlestick charts are combined with other technical analysis tools and work on all time frames and financial instruments.
There are reversal models of the current trend and continuation models. Models may consist of one or more candlesticks. Not only is the colour important, but also the ratio of the candlestick body and its shadows and the place where the candlestick is located on the chart.
Technical analysis examples
As an example, we suggest you look at how the Commodity Channel Index oscillator works. If you select it on the platform, set the period at 14. When the CCI line goes above the upper 100 level, you can tell that the price is overbought. When it reaches below -100, it will signal as oversold.
The goal with this technical analysis strategy is to find a reversal candlestick pattern on the chart while the CCI is above 100 or below -100, implying that the price will move back to neutral levels.
As a rule, some kind of reversal pattern is formed on the chart at this time. Most often, we can observe a Bullish Engulfing after the oversold conditions and a Bearish Engulfing pattern when the market is overbought.
Thus, if the reversal pattern is formed simultaneously with the return of the level to a neutral position, it is a signal to open a trade.
How to use technical analysis
The most effective application for TA on the stock market is to determine entry and exit points. You may make mistakes when doing technical analysis. Learn from your mistakes, and you will be more patient in waiting for signals in the future.
Traders use technical analysis on all timeframes, from minutes to months and longer. Moreover, the bigger the timeframe, the less chaos there is and the better the technical analysis works.
Analysts believe that it is possible to enter a good trade in any market if the trend is detected correctly, a position is opened in the direction of the trend, and then the position is closed.
For example, if the price falls to a support level, you should take the opportunity to open a buy position. And if the price rose to a resistance level and turned around to open a sell position.
Trading with technical analysis
Each of the methods of technical analysis is based on the basic postulates and tries to determine the balance between the buyers and sellers in trading. This balance ultimately shows whether the price will rise, fall or stay in place.
Each method of technical analysis has its own strengths and weaknesses in trading on the stock market. That is why the right way for beginners is to study all the nuances and combine the main methods of technical analysis in the correct proportions.