Bill Williams é o criador de alguns dos indicadores de mercado mais populares: Awesome Oscillator, Fractals, Alligator e Gator.

Não perca seu tempo. Acompanhe o impacto das NFP no dólar dos EUA!
Aviso de coleta de dados
Nós mantemos um registo dos seus dados para fazer funcionar este sítio web. Ao clicar no botão, concorda com a nossa Política de Privacidade.

Livro de Forex para principiantes
O seu grande guia no mundo do trading.
Confira a sua caixa de entrada!
Encontrará no nosso e-mail o Livro Básico de Forex. Basta tocar no botão para obtê-lo!
Alerta de risco: ᏟᖴᎠs são instrumentos complexos e vêm com um alto risco de perda rápida do dinheiro devido à alavancagem.
68,53% das contas de investidores de retalho perdem dinheiro ao negociar ᏟᖴᎠs com este provedor.
Deve considerar se entende como funcionam os ᏟᖴᎠs e se tem condições de assumir o alto risco de perder o seu dinheiro.
2022-08-26 • Atualizado
Informação não é consultoria em investimentos
“Para ter sucesso no trading, preciso de anos de experiência!”
Quantas pessoas concordam com essa frase? Se você é uma delas, provavelmente nunca ouviu falar de Richard Dennis, que treinou um grupo de traders novatos — chamado de Turtle Traders, ou “traders tartaruga” — que conseguiram lucrar 100 milhões de dólares em pouco tempo. Eles provaram que quando se segue um conjunto simples de regras, até um iniciante pode ganhar um bom dinheiro.
O nome incomum nada tem a ver com a velocidade das operações. Assim como a maioria das ideias autênticas, o plano de treinar traders inexperientes surgiu de uma disputa entre Richard Dennis e William Eckhardt, dois traders americanos de commodities. O debate era sobre a importância de grandes habilidades e experiência no trading: enquanto Dennis acreditava que poderia treinar pessoas para serem grandes traders, seu amigo Eckhardt confiava no papel decisivo da genética. Para resolver essa disputa, os dois decidiram fazer um grande anúncio no Barron’s, no Wall Street Journal e no New York Times. Eles selecionaram 23 candidatos e os chamaram para Chicago para operarem com contas pequenas.
“Nós vamos criar traders assim como eles criam tartarugas em Singapura”, disse Dennis.
Os traders, então, ganharam a alcunha de “tartarugas”. Você provavelmente já viu essa referência no livro “Street Smarts: High Probability Short-Term Trading Strategies”, por Laurence Connors e Linda Raschke. De fato, os autores formularam uma estratégia chamada Sopa de Tartaruga com base no experimento de Chicago.
Richard Dennis, conhecido como “Prince of Pit” (Príncipe do Abismo, em tradução livre), é um trader de commodities bem conhecido. Relata-se que ele fez US$200 milhões com US$1.600 em cerca de 10 anos. Em 1974, ele teve sucesso operando no mercado da soja e lucrou US$500.000. Até o final daquele ano, já tinha dobrado o valor e virado um milionário. Willaim Eckhardt é seu amigo e fundador de uma firma de gestão de investimentos alternativos chamada Eckhardt Trading Company, que administra mais de US$1 bilhão em contas, produtos offshore e onshore. Matemático, ele acreditou que um conjunto robusto de análises e estatísticas era indispensável para a conquista de grandes resultados no trading.
Vamos ver a estratégia fácil que nossos milionários ensinaram aos traders tartaruga.
As Tartarugas optaram por negociar em mercados com liquidez. Logo, você pode escolher qualquer um dos pares de moedas principais, commodities (petróleo, ouro, prata) ou até um índice de futuros de ações (S&P500, DAX30).
Para identificar a entrada perfeita, os traders tiveram que operar nos timeframes diários.
A mágica da Estratégia das Tartarugas se baseia em uma fórmula simples:
Tendências + Rompimentos = Lucros.
Geralmente, as Tartarugas eram seguidoras de tendências e observadoras de rompimentos. Elas abriam posições longas ou curtas após rompimentos para cima ou para baixo, e então mantinham suas posições abertas pelo tempo em que a tendência seguia firme. Como você já deve ter deduzido, elas abriam uma posição longa em um rompimento para cima e vendiam em rompimentos para baixo. As tartarugas entravam longas ou curtas sempre que se observava uma condição de rompimento, desde que os limites de riscos fossem respeitados. Havia dois sistemas para entrar no mercado.
1) Sistema de curto prazo com base no rompimento de 20 dias.
As tartarugas entravam no mercado quando o preço rompia a máxima ou mínima do período 20. O rompimento se confirmava com 1 pip acima dessa máxima/mínima de 20 dias. A entrada no rompimento de 20 dias era feita somente quando se verificava falha no rompimento anterior, algo que se chama de “regra da contradição” e significa que a multidão espera que a mesma coisa se repita. A Stop Loss é a mínima de 10 dias para posições longas e a máxima de 10 dias para posições curtas.
2) Sistema de longo prazo com base no rompimento de 55 dias
Este padrão foi operado quando o trader acompanhou tendências de mercado maiores. Ao optar por este padrão, era necessário ater-se à regra dos 55 dias e sempre entrar em caso de rompimento.
Quando as Tartarugas operavam, elas abriam uma posição com uma unidade de risco que, em seguida, acumulava em unidades iguais dependendo da direção na qual a tendência se deslocava. As unidades de risco eram o elemento-chave do sistema das Tartarugas. Vamos ver como que isso funciona.
Os traders ajustavam o tamanho de suas posições com base na volatilidade do ativo. A regra básica era a seguinte: o trader tinha que escolher a posição correta para determinado ativo, em dólares. Cada posição das Tartarugas poderia ser aumentada ou reduzida nas chamadas unidades de risco. Dennis deu uma fórmula para as Tartarugas que ajudava a identificar o número de unidades de risco, com base no cálculo do parâmetro N, que representa a volatilidade de um determinado mercado. Era a Average True Range (ATR) de 20 períodos.
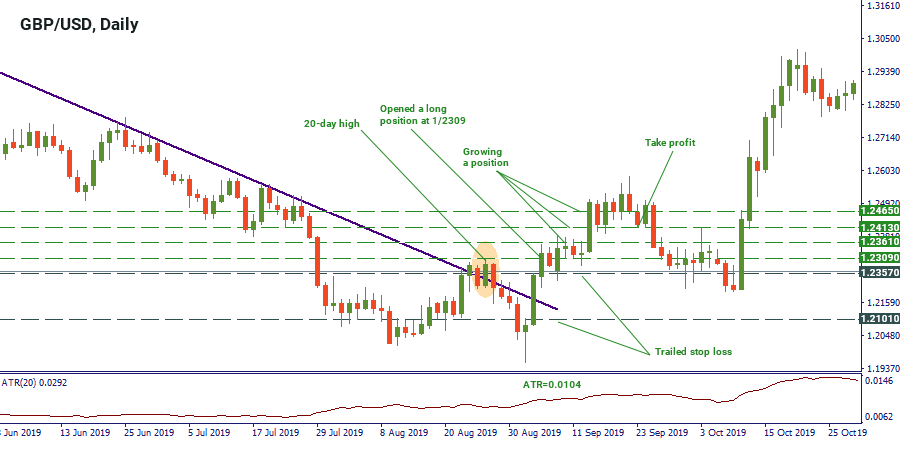
Em 5 de setembro de 2019, o valor ATR do GBP/USD era 0,0104. Este é nosso N. Isso significa que a movimentação diária média do GBP/USD é de 104 pips. Vamos converter nossos dados para USD. Com um tamanho de contrato de US$1.000, temos:
Volatilidade do Dólar = 0,0104x1000 = US$10,4
Se a moeda de cotação não for USD, deve-se fazer a conversão para USD.
As Tartarugas sempre ajustavam suas posições utilizando “fatias de risco” iguais, conhecidas como unidades. Uma unidade representa 1% do risco. Exemplo: com uma conta de US$10.000, uma unidade tem valor monetário de US$100.
Vamos, então, calcular quantos contratos o sistema das Tartarugas exige para operar GBP/USD:
Tamanho da unidade = US$100/US$10,4 = 9 contratos.
Logo, para operar GBP/USD, o sistema das Tartarugas funcionaria com múltiplos de 9 contratos para este tipo de tamanho de conta.
Quando as condições eram favoráveis, as Tartarugas aumentavam suas posições para o risco máximo alocado, novamente com base na volatilidade e nos cálculos de N. As Tartarugas aumentavam suas posições em incrementos ou metade deles, ou seja, de N ou ½N.
As Tartarugas seguiam regras bem rígidas em relação às Stop Loss, calculando-as também com base na medida de N. A regra de 2% era usada para limitar os riscos. Dessa forma, quando a posição se deslocava contra o trader por mais de 2N, esta era fechada. O trailing das Stop Loss também era praticado.
Os alunos de Richard Dennis foram instruídos a utilizarem ordens-limite em vez das ordens de mercado. Dessa forma, esperava-se que as ordens fossem preenchidas a um preço melhor que o preço de mercado atual.
Colocar as Take Profits perfeitas era algo difícil para as Tartarugas, pois tinham medo de perder boas movimentações de preço. Conforme suas regras, quando o(a) trader mantém uma posição longa e o preço começa a cair, ele(a) deve sair na mínima de 10 dias. Por outro lado, se o(a) trader mantém uma posição curta e o preço começa a subir, ele(a) deve sair na máxima de 20 dias.
Vamos considerar o sistema de curto prazo tomando o gráfico de GBP/USD como exemplo. Nota-se no gráfico abaixo que o preço tem se deslocado dentro de uma tendência de queda. O preço rompeu a tendência descendente no dia 4 de setembro e atingiu a máxima de 20 dias no dia seguinte. A máxima de 20 dias estava em 1,2308 e, portanto, abrimos uma posição longa em 1,2309 (1 pip acima da máxima). Na sequência, indicamos onde precisávamos aumentar nossa posição inicial. Com N igual a 0,0104; tomamos as seguintes medidas:
+1 unidade: 1,2309+1/2x0,0104 = 1,2361
+1 unidade: 1,236+1/2x0,0104 = 1,2413
+1 unidade: 1,2413+1/2x0,0104=1,2465
Nos preços acima, acrescentamos unidades (abrimos mais posições). No começo, nossa Stop Loss foi colocada em 1,2309-2N=1,2101; mas fizemos o trailing à medida que abrimos mais posições. A última ficou em 1,2257.
Após vários dias em alta, o preço começou a cair. Quando ele foi abaixo da mínima de 10 dias em 1,2412; optamos por fechar nossa posição.

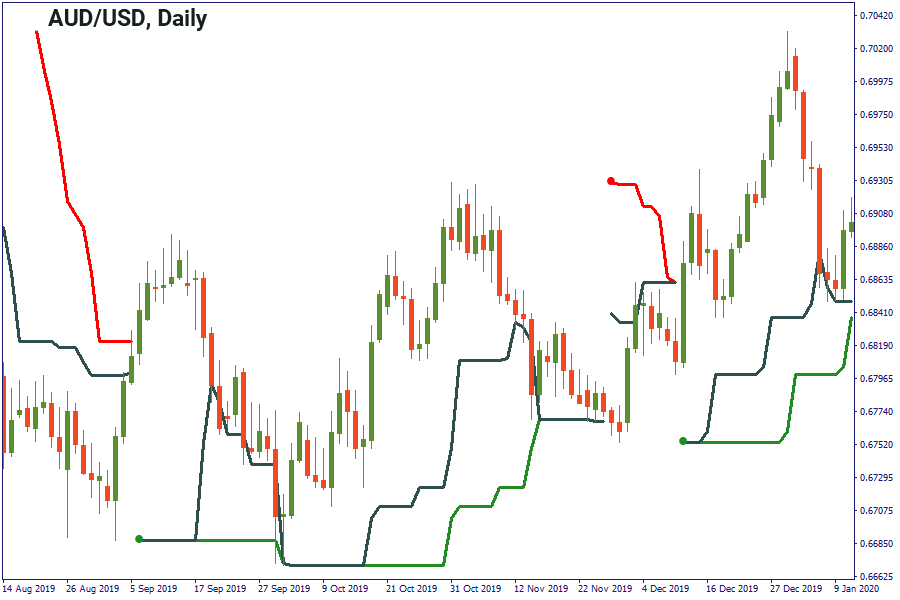
Pode ser difícil esperar 20 dias até o preço chegar a certo ponto. Como resultado, você pode entrar na operação e acabar saindo cedo demais. Por sorte, no site oficial do MT é possível encontrar um link para o indicador Turtle Trade, que faz a contagem dos dias para você e ajuda a identificar a entrada correta.

O sistema Turtle Trade foi revolucionário na época do experimento e mostrou que o trader não precisa de nenhum dom para ganhar dinheiro no mercado. Ainda assim, é necessário ter paciência e aguardar o máximo possível de confirmações. O mercado agora é mais traiçoeiro que no século XX, e é por isso que é sempre necessário tomar decisões ponderadas em relação aos investimentos.

Bill Williams é o criador de alguns dos indicadores de mercado mais populares: Awesome Oscillator, Fractals, Alligator e Gator.

As estratégias de tendência são boas: podem gerar resultados consideravelmente bons em qualquer tempo gráfico e com qualquer ativo. A ideia principal da estratégia ADX é tentar apanhar o arranque da tendência.

As estratégias de contratendência são sempre as mais perigosas, porém as mais lucrativas. Temos o prazer de apresentar uma excelente estratégia de contratendência que funciona em qualquer mercado e com qualquer ativo.
Seu pedido foi aceito
Faremos contacto no intervalo de horário escolhido
O próximo pedido de contato para este número de telefone estará disponível em 00:30:00
Se tiver um problema urgente, por favor, contacte-nos via
Chat ao vivo
Erro interno. Por favor, tente novamente mais tarde