

Williams’ Strategy
Bill Williams is the creator of some of the most popular market indicators: Awesome Oscillator, Fractals, Alligator, and Gator.

Don’t waste your time – keep track of how NFP affects the US dollar!
Data Collection Notice
We maintain a record of your data to run this website. By clicking the button, you agree to our Privacy Policy.

Beginner Forex Book
Your ultimate guide through the world of trading.

Check Your Inbox!
In our email, you will find the Forex 101 book. Just tap the button to get it!
Risk warning: ᏟᖴᎠs are complex instruments and come with a high risk of losing money rapidly due to leverage.
70.72% of retail investor accounts lose money when trading ᏟᖴᎠs with this provider.
You should consider whether you understand how ᏟᖴᎠs work and whether you can afford to take the high risk of losing your money.
Warning! Old version of the browser!
Press one of the icons below to proceed to the official website of the developer and download the latest version of your browser.

Online Forex broker
2022-11-18 • Updated
Information is not investment advice
Beginner traders often look for a magic tool - a single indicator that would help them make big profits. They may get lucky for a while, but eventually, the magic disappears. When losses kick in, they tend to think that the reason for that is the unlucky indicator. So they go for another one, and the same thing happens.
Needless to say, it is a wrong approach based on the misunderstanding of the nature of the indicators. None of them is designed to make a flawless interpretation or prediction of the market. Moreover, none of them is designed to correlate with the other indicators. Rather, they are supposed to be used in combination, including the situations when they contradict each other.
Alexander Elder is a well-known trader, famous for releasing several guidebooks on trading strategies. He invented a so-called “triple screen” approach. It combines various indicators and filters out their disadvantages while preserving their strengths. In a nutshell, it provides a three-tier approach to make a trade decision. Let’s have a look at it.
First, you decide which timeframe you want to trade on. Whichever it is, you will have two more timeframes to look at in relation to the chosen one: a higher one, which provides a greater context of the market, and a lower one, which provides a detailed view of the current situation and gives you a chance to choose a precise entry point.
For example, if you want to trade intraday, you may choose the H1 chart as the main observation field, the H4 to see the greater market context and the M15 timeframe for the entry point specifications. Each will be reflected in one of the three screens, as the table below shows.
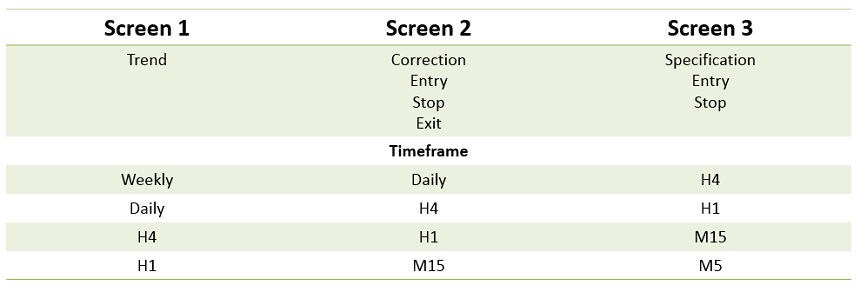
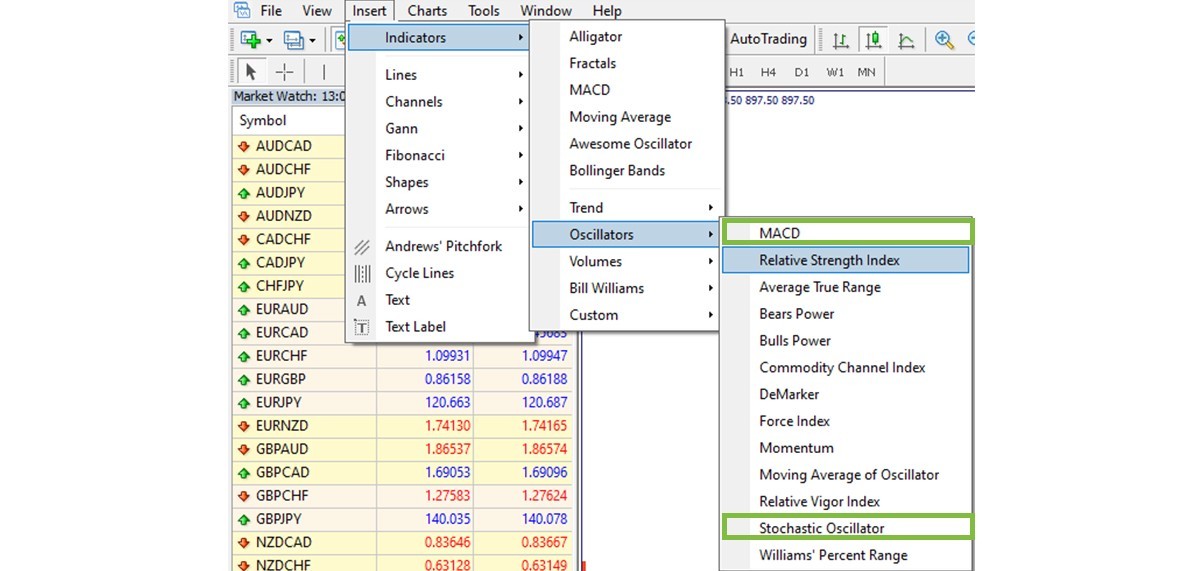
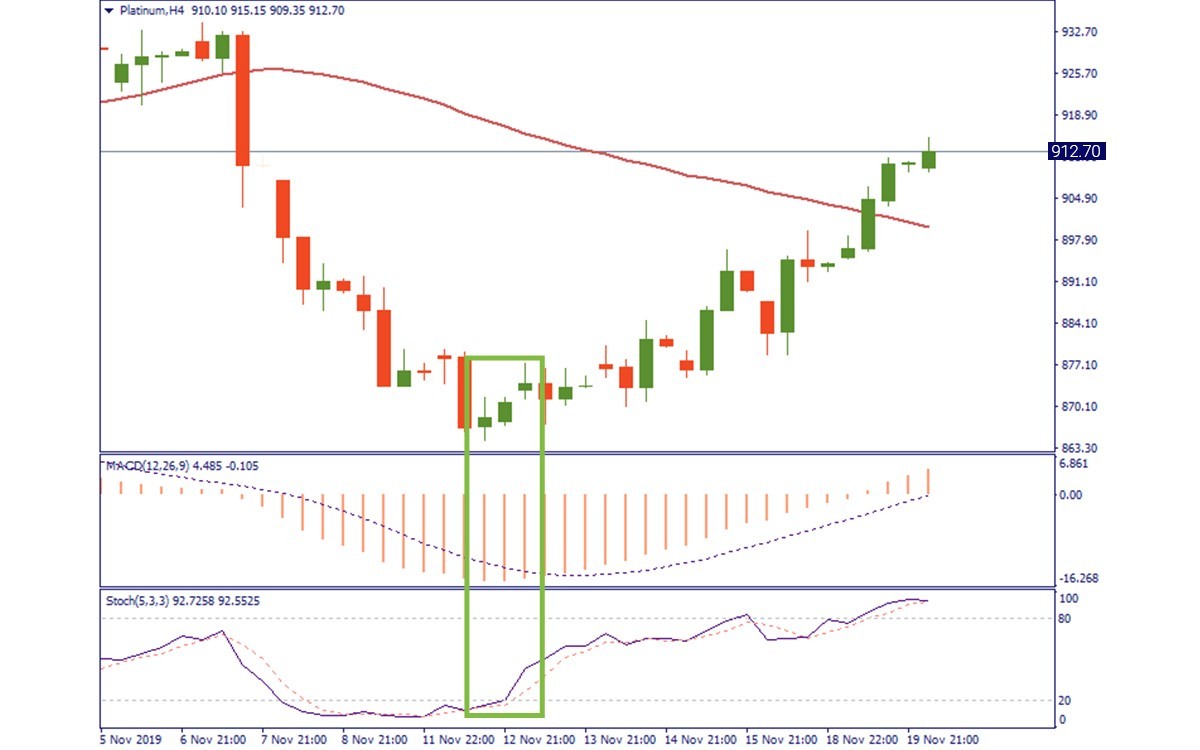
Let’s say we want to make some trades with Platinum. We open three charts: H4, H1, M15. On the H4 chart of Platinum, we notice that the price dropped and then entered a correction area. Based on this, we assume that it will go further up for a while within this correction course. Therefore, our idea will be to buy now and to sell when the price reaches higher levels. Now, we want to verify our observation and cross-check it against various indicators. For this purpose, we open the indicators menu and attach the MACD and the Stochastic Oscillator (the below image shows how to do that).
We see that the MACD has reached the extreme low below the signal line (the selected area on the below image). While the Stochastic Indicator shows the fast line (solid) crossing the slow line (punctured) bottom-up within the 0-20% zone. Both are normally interpreted as signs of the oversold state in the market and a signal to buy. Thus, we now have the confirmation from two indicators that our market interpretation is very likely correct and our strategy has a high chance of being successful. Now, we proceed to the second screen.
The second screen serves to reconfirm the observation made on the first screen and to provide a more precise entry area. To do that, we add an RSI to the chart window. The below image shows how to select it.
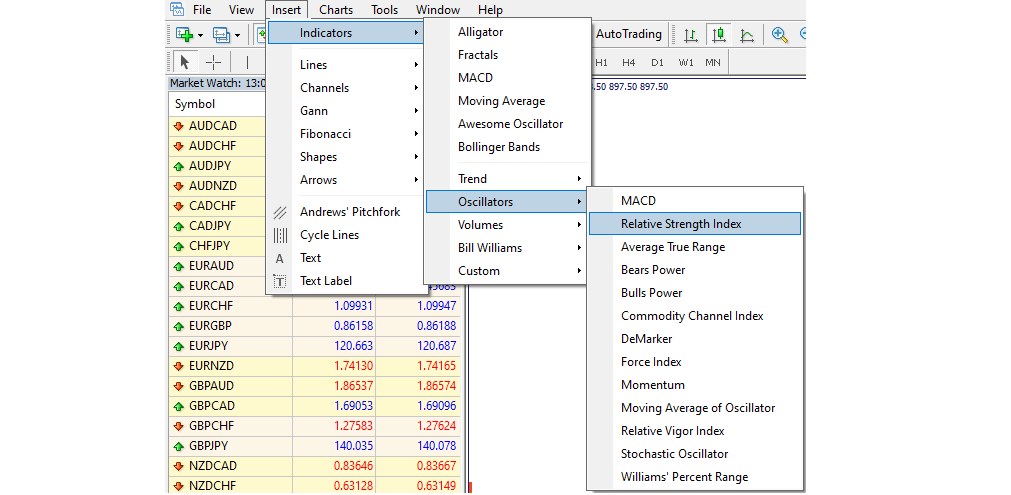
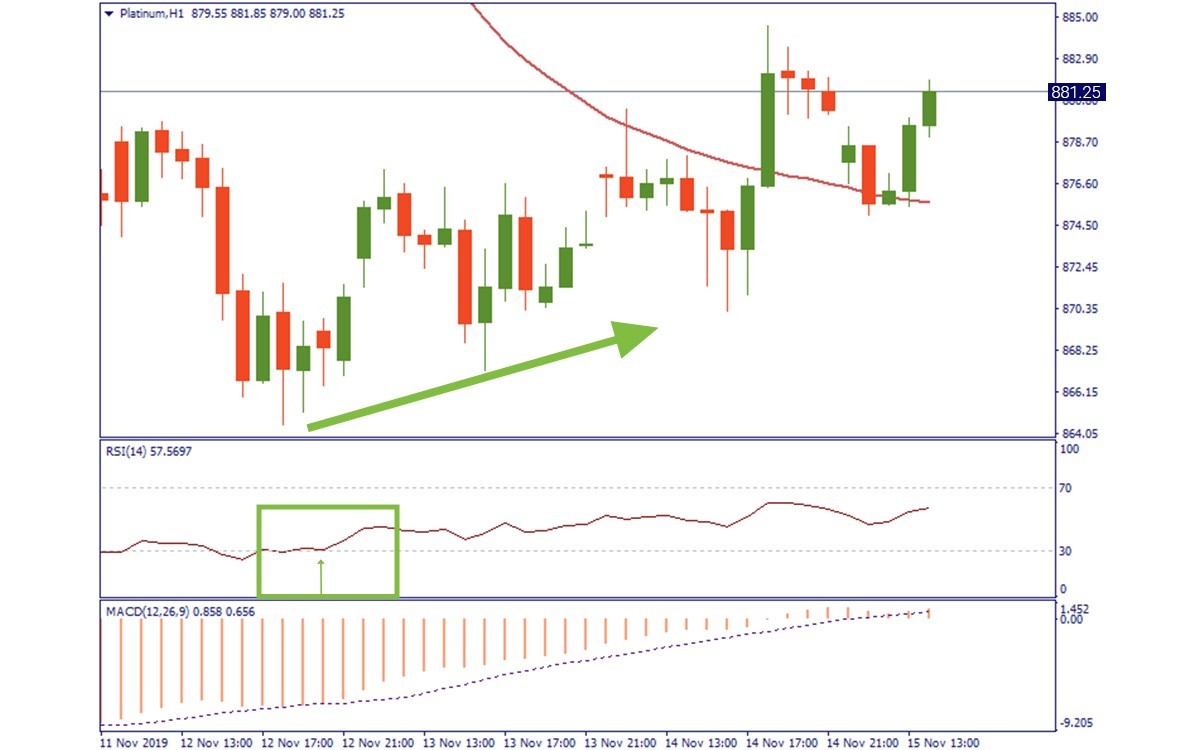
The RSI is a good tool, giving a fairly precise indication of the market strength and the moments where it is safe to open a position. As we are planning to buy on a correction rising trend, we will try to catch the moment to open a long position. The RSI crossing the 30% shows us exactly that moment. On the H1 chart of Platinum, we see that it crossed the oversold level. Thus, we understand that the bullish push of the market is pretty strong. That gives us a second check with our trade strategy. Therefore, we proceed to the third screen to pick the level to open longs.
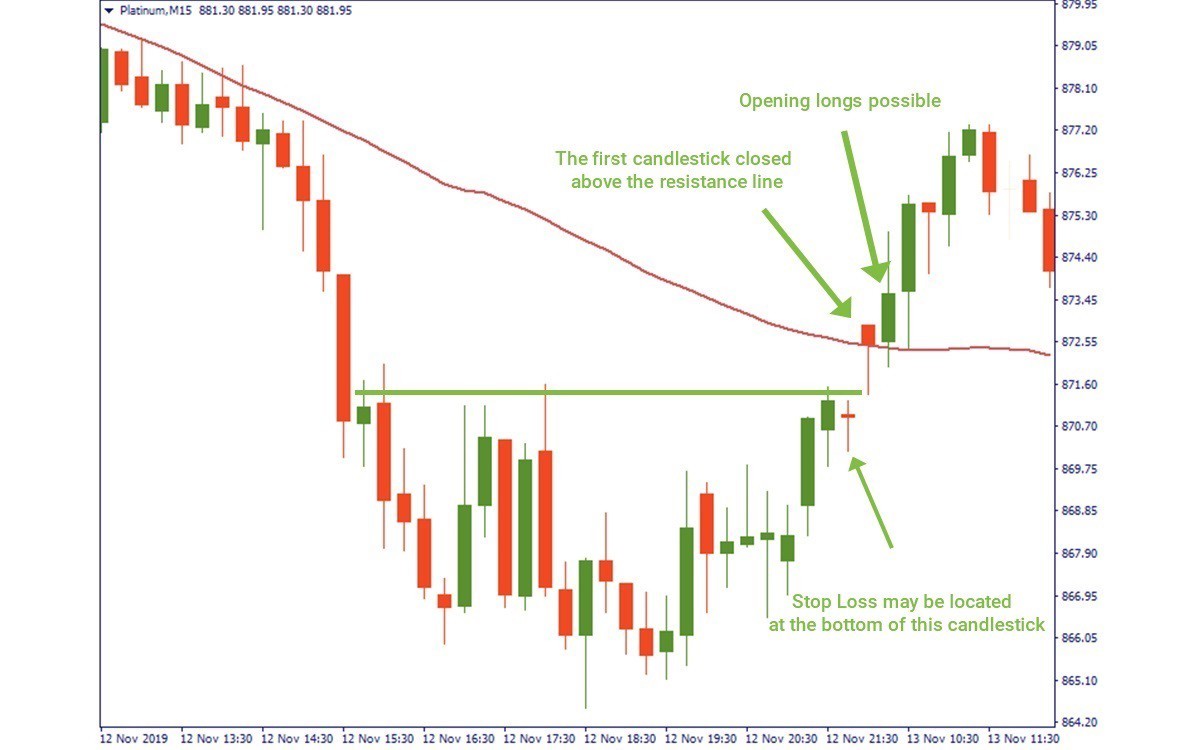
The third screen does not necessarily require any indicator. On the M15 chart of Platinum, we see in detail the wave that was indicated as an entry area on the previous chart. We just want to reconfirm now that there will be no sudden downward reversal, that would invalidate our market correction assumption. We wait for the price to rise above the indicated level along with the 50-period Moving Average. That is a signal for us to buy. We may open a long position right after the first candlestick closes above the resistance line, locating the stop loss at the bottom of the previous candlestick down.
The observed example provides a strategy for the local uptrend following a general downtrend. In other words, we tried to “ride the wave”: on the falling market, we buy at lows and sell at highs of each cascade. The vice versa scenario would work for the rising market.
Now, the traders may ask: what if the price acts differently compared to what we predicted. To this, we answer: there is no perfect trading methodology. Perfecting this approach is the duty of the trader, who wants to look for specific situations where it is applicable. Alternatively, the trader would understand, in which exact scenarios this trading strategy is inapplicable. The idea of this strategy is simple: apply several filters to your decision making and use various indicators when making your trades.

Bill Williams is the creator of some of the most popular market indicators: Awesome Oscillator, Fractals, Alligator, and Gator.

Trend strategies are good - they may give significantly good results in any time frame and with any assets. The main idea of the ADX Trend-Based strategy is to try to catch the beginning of the trend.

Counter-trend strategies are always the most dangerous but also the most profitable. We are pleased to present an excellent counter-trend strategy for working in any market and with any assets.


Your request is accepted.
We will call you at the time interval that you chose
Next callback request for this phone number will be available in 00:30:00
If you have an urgent issue please contact us via
Live chat
Internal error. Please try again later