


Estrategia de Williams
Bill Williams es el creador de algunos de los indicadores del mercado más populares: oscilador asombroso, fractales, alligator y gator.

¡No pierdas tu tiempo – mantente informado para ver cómo las NFP afectan al USD!
Aviso de Recopilación de Datos
Mantenemos un registro de tus datos para ejecutar este sitio web. Al hacer click en el botón, estás aceptando nuestra Política de Privacidad.

Manual para Principiantes de Forex
Tu guía definitiva a través del mundo del trading.

¡Revisa Tu Correo!
En nuestro correo electrónico, encontrarás el Manual de Forex 101. ¡Solo toca el botón para descargarlo!
Advertencia de Riesgo: Los ᏟᖴᎠs son instrumentos complejos y tienen un alto riesgo de pérdida de dinero rápidamente debido al apalancamiento.
El 66,43% de las cuentas de los inversores minoristas pierden dinero al operar ᏟᖴᎠs con este proveedor.
Deberías tener en consideración si comprendes el funcionamiento de los ᏟᖴᎠs y si puedes darte el lujo de arriesgarte a perder tu dinero.
¡Atención! ¡Su navegador no está actualizado!
Presione uno de los iconos de abajo para pasar a la página oficial del desarrollador y descargar la última versión del navegador.

Broker De Forex Online
2022-08-26 • Actualizada
Esta información no son consejos para inversión
Todo trader desea lograr los mejores resultados. Sin embargo, solamente un trader inteligente comprende la importancia del análisis de rendimiento en sus operaciones diarias. Imagínate, puedes abrir operaciones al azar e incluso obtener ganancias en algunas de ellas, pero sin unos buenos datos estarás un poco perdido. Analizar tu rendimiento en el trading es especialmente necesario cuando estás probando o desarrollando un nuevo sistema para operar. Este artículo cubrirá las principales métricas del rendimiento en el trading que analizan tus acciones al operar y te ayudarán a crear el enfoque perfecto.
Como probablemente habrás adivinado en la parte de la introducción, el término "rendimiento en el trading" se refiere a un método para evaluar los resultados de un trader. El trader puede usar diferentes métricas para obtener una evaluación adecuada y llegar a una conclusión decente.
El ejemplo más simple de una métrica de este tipo es el retorno del capital (ROC). Se calcula como la suma de las ganancias dividida por el capital invertido. Por ejemplo, si depositas $1.000 y obtienes una ganancia de $200 durante un período específico, tu retorno sería del 20%.
Además del rendimiento, existen otras medidas que puedes utilizar para evaluar tus resultados en el trading. En el siguiente párrafo, hablaremos sobre las técnicas más populares.
Hay diferentes maneras de hacerle seguimiento a tu rendimiento en el trading. Por ejemplo, algunos traders utilizan Microsoft Excel, registrando su depósito, el tamaño del lote por orden, el spread, el take profit y el stop loss. En función de estos datos, calculan automáticamente las principales métricas para el análisis de rendimiento, incluyendo el precio objetivo promedio de ganancias/pérdidas, etc. Si operas en MetaTrader 4 o 5, puedes utilizar las herramientas que proporciona este software.
Generación de Informes de Rendimiento con MT
Si deseas ver tu rendimiento en el trading en MetaTrader, abre la barra "Historial" en la ventana "Caja de Herramientas".
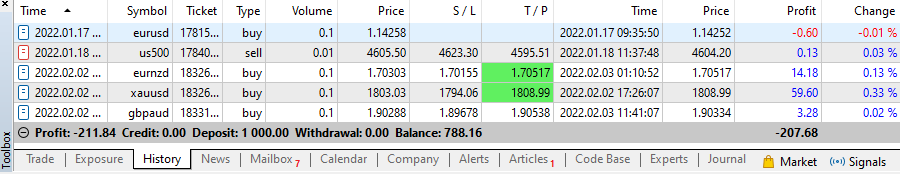
Primero, haces click derecho en el gráfico y elige el período que deseas analizar.
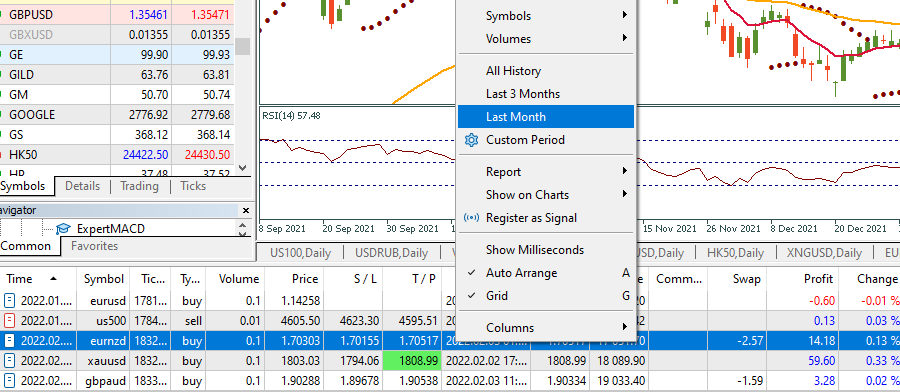
Elegimos un mes. Después de eso, haz click en "Informe" y guárdalo como HTML o XML. Si lo guardas como HTML, puedes usar cualquier navegador para abrir este archivo.

MetaTrader generará un informe que se verá así:
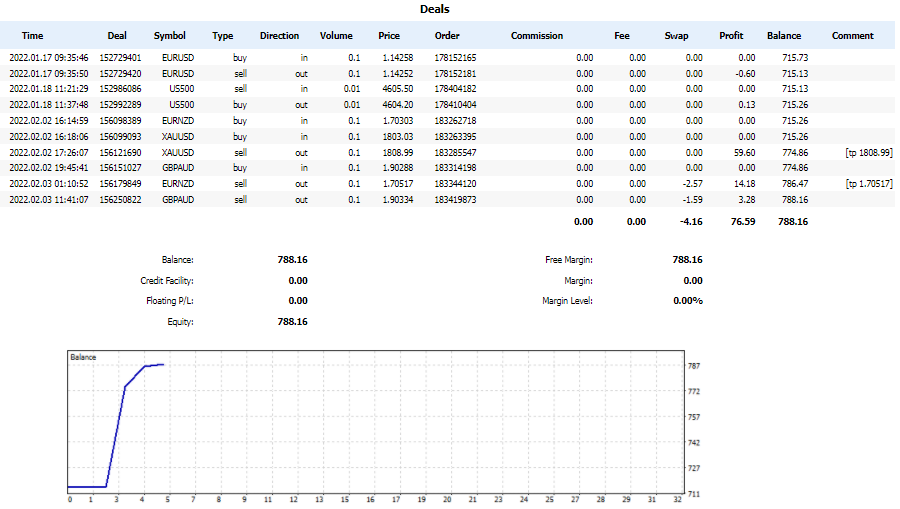
Debajo del gráfico, MetaTrader proporciona algunas estadísticas de trading útiles.
¡Veamos qué significan todas estas métricas!
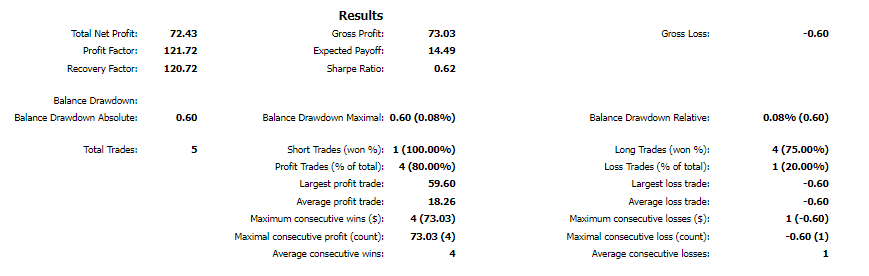
En primer lugar, comprendamos la diferencia entre la ganancia bruta y la ganancia neta. La ganancia bruta muestra la ganancia antes de cualquier gasto o costo, mientras que la ganancia neta es la ganancia del trader después de todos los costos. En Forex, los costos pueden ser cargos por swap y comisiones pagadas al broker.
El factor de ganancias muestra cuánto dinero ganas en comparación con cuánto dinero pierdes. Por ejemplo, en el caso anterior, tuvimos cinco operaciones. Hicimos dinero en cuatro de ellas con las siguientes ganancias: $0,13, $14,18, $59,6 y $3,28. Por otro lado, perdimos $0,6 en una operación. Si dividimos el valor total de las posiciones ganadoras menos los swaps por el valor total de las posiciones perdedoras, obtenemos:
((0,13+14,18+59,6+3,28)-4,16)/0,6 = 121,72
Esto significa que tus ganancias fueron 121,7 veces superiores a tus pérdidas. Esta es una cifra extremadamente alta. Ten en cuenta que si pruebas una estrategia, se recomienda enormemente que el factor de ganancias esté entre 1,75 y 4. De lo contrario, la estrategia no es confiable.
El drawdown absoluto (reducción absoluta) es la diferencia entre el depósito inicial y el punto más bajo que la cuenta de trading alcanzó por debajo del nivel de depósito. Por ejemplo, si depositaste $1.000, tu cuenta alcanzó un máximo de $2.000 y luego cayó a $800, el drawdown absoluto sería de $200 ($1000- $800 = $200). Esta cifra representa tu mayor pérdida en comparación con el depósito inicial.
El drawdown máximo (reducción máxima) muestra la diferencia entre el valor más alto y el más bajo que ha alcanzado tu cuenta. Usando el ejemplo en la descripción de la definición del drawdown absoluto, el drawdown máximo sería de $1.200 ($2.000-$800).
El drawdown relativo (reducción relativa) es la caída máxima de tu capital en términos de porcentaje. Se puede calcular como el drawdown máximo dividido por el valor de capital máximo multiplicado por 100%. En nuestro caso, el drawdown relativo sería igual al 60%.
Las tres métricas son cruciales para el trader, ya que ayudan a identificar el factor de riesgo de tu cuenta de trading La calidad de tu drawdown dependerá del tamaño de la cuenta de trading. Si el tamaño de tu cuenta es grande, un drawdown del 5-6 % es lo normal y debes mantenerlo por debajo del 6%. Si el tamaño de tu cuenta es pequeño, entonces el 15-20% del drawdown es lo normal, y un drawdown superior al 20% podría considerarse riesgoso.
Basándonos en el cálculo del drawdown, podemos identificar nuestro factor de recuperación. El factor de recuperación es igual al valor absoluto de la ganancia neta dividido por el drawdown máximo. Por ejemplo, si nuestra ganancia neto es de 72,43 y el drawdown máximo es de 0,6, nuestro factor de recuperación será:
72,43/0.6 = 120,72.
El factor de recuperación debe ser usualmente superior a 1. Según los traders, cuanto mayor sea el factor de recuperación, más rápido se recuperará una operación de los drawdowns.
Otro indicador interesante del informe es el Ratio de Sharpe. Fue desarrollado por el premio Nobel William F. Sharpe. Este ratio ayuda a los inversores a comprender el rendimiento de una inversión en comparación con su riesgo. Cuanto mayor sea el ratio, mayor será el rendimiento del trader en relación con el riesgo asumido. Por lo general, los traders prefieren tener una Ratio de Sharpe igual o superior a 1. Si el ratio es menor a 1, el trader está asumiendo demasiado riesgo en comparación con el rendimiento esperado. La fórmula clásica del Ratio de Sharpe se ve así:
Ratio de Sharpe = (Rentabilidad de una portafolio – Tasa libre de riesgo) / Desviación estándar del exceso de rentabilidad del portafolio.
En MetaTrader, el Ratio de Sharpe se calcula como la ganancia promedio a la desviación estándar.
También hay un Ratio de Sortino, que es muy similar al Ratio de Sharpe, pero con algunos ajustes. El Ratio de Sortino no tiene en cuenta la volatilidad total de la inversión. Aparte del Ratio de Sharpe, se enfoca en la volatilidad a la baja. Se calcula encontrando la diferencia entre el rendimiento promedio de una inversión y las tasas libres de riesgo. El resultado se divide por la desviación estándar de los rendimientos negativos. Es preferible un ratio alto, ya que muestra que el trader obtendrá un mayor rendimiento por cada unidad de riesgo a la baja.
El tercer hermano de los ratios de Sharpe y Sortino es el Ratio de Calmar, que toma el drawdown como medida de riesgo.
Además de las métricas enumeradas en el informe de MetaTrader, existen otras que puedes utilizar para analizar tu rendimiento. Veámoslas en detalle.
Esta no es exactamente una métrica, sino una regla de gestión de riesgos. Si la usas, eliges el porcentaje que estás dispuesto a arriesgar por operación y no lo excedes. Una cifra que represente el 2% es lo que normalmente seleccionan los traders. De esta manera, evitas que tus operaciones sufran drawdowns inesperados.
Si eliges este método, te enfocas en la cantidad de puntos o pips que deseas arriesgar por operación. Sin embargo, los expertos no recomiendan utilizar este enfoque, ya que aconsejan enfocarse en el % de riesgo.
En los libros clásicos sobre Forex, se suele recomendar utilizar una relación riesgo/recompensa de 1:3. Es decir, la recompensa de una operación en particular debería ser tres veces mayor al riesgo.
Estos datos muestran cuántas operaciones ganadoras hay en comparación con el número de operaciones perdedoras que tiene el trader. Por ejemplo, si tienes 6 operaciones exitosas de 10, tendrías una relación de ganancias del 60%. A veces, los traders rentables tienen una relación de ganancias menor al 50%. Esto puede suceder porque la ganancia en sus operaciones ganadoras superan la pérdida que obtienen en sus operaciones perdedoras.
Después de leer este artículo, puedes buscar el análisis de tus operaciones en MetaTrader e interpretar las métricas que se mencionan allí. Vale la pena mencionar que estos elementos de análisis de rendimiento son ideales para probar una estrategia, ya sea manualmente o con la ayuda de un back tester. Si programas un robot de trading, el análisis del drawdown y de los factores de ganancias serán claves para comprender futuras mejoras.

Bill Williams es el creador de algunos de los indicadores del mercado más populares: oscilador asombroso, fractales, alligator y gator.

Las estrategias de tendencia son buenas: pueden dar resultados significativamente buenos en cualquier temporalidad y con cualquier activo. La idea principal de la estrategia ADX basada en tendencia es intentar posicionarse en el comienzo de la tendencia.

Las estrategias contra tendencia siempre son las más peligrosas, pero también las más rentables. Nos complace presentar una excelente estrategia contra tendencia para trabajar en cualquier mercado y con cualquier activo.


Su solicitud ha sido aceptada
Te llamaremos en el intervalo de tiempo que elijas
La próxima solicitud de devolución de llamada para este número de teléfono estará disponible en 00:30:00
Si tienes algún problema urgente, contáctanos a través del
Chat en vivo
Error interno. Por favor, inténtelo nuevamente más tarde