


Williams-Strategie
Bill Williams ist der Schöpfer einiger der bekanntesten Marktindikatoren: Awesome Oscillator, Fraktale, Alligator und Gator.

Verschwenden Sie nicht Ihre Zeit - beobachten Sie, wie die NFP den US-Dollar beeinflusst!
Hinweis zur Datenerfassung
Wir speichern Ihre Daten für den Betrieb dieser Website. Durch Drücken der Taste stimmen Sie unserer Datenschutzpolitik zu.

Forex-Buch für Anfänger
Ihr Leitfaden durch die Welt des Handels.

Überprüfen Sie Ihre Inbox!
In unserer E-Mail finden Sie das Buch Forex 101. Tippen Sie einfach auf die Schaltfläche, um es zu erhalten!
Risikowarnung: CFDs sind komplexe Instrumente und bringen ein hohes Risiko mit sich, aufgrund von Hebelwirkung schnell Geld zu verlieren.
66,43 % der Privatanleger-Konten verlieren Geld, wenn sie mit diesem Anbieter CFDs handeln.
Sie sollten sich überlegen, ob Sie verstehen, wie CFDs funktionieren und ob Sie es sich leisten können, zu riskieren, Ihr Geld zu verlieren.
Warnung! Alte Version des Browsers!
Drücken Sie eines der Symbole unten, um auf die offizielle Website des Entwicklers vorzugehen und die neueste Version Ihres Browsers herunterzuladen.

Online Forex- broker
2022-08-26 • Aktualisiert
Informationen sind keine Investitionsberatung
Allgemein
Zusammen mit anderen bekannten Indikatoren entwickelte Bill Williams den Fraktal-Indikator, der auf dem Begriff des Fraktals basiert, den er in die Forex-Wissensbasis eingeführt hat. Es gibt verschiedene Möglichkeiten, es anzuwenden. Im Allgemeinen wird es verwendet, um ein stärkeres Trendpotenzial im Markt zu identifizieren und oft Marktumkehrpunkte zu erkennen. Wie bei jedem anderen Indikator gibt es Vor- und Nachteile, und wir werden all dies im Folgenden ansprechen, damit Sie ihn effektiv in Ihren täglichen Aktivitäten einsetzen können.
Suche
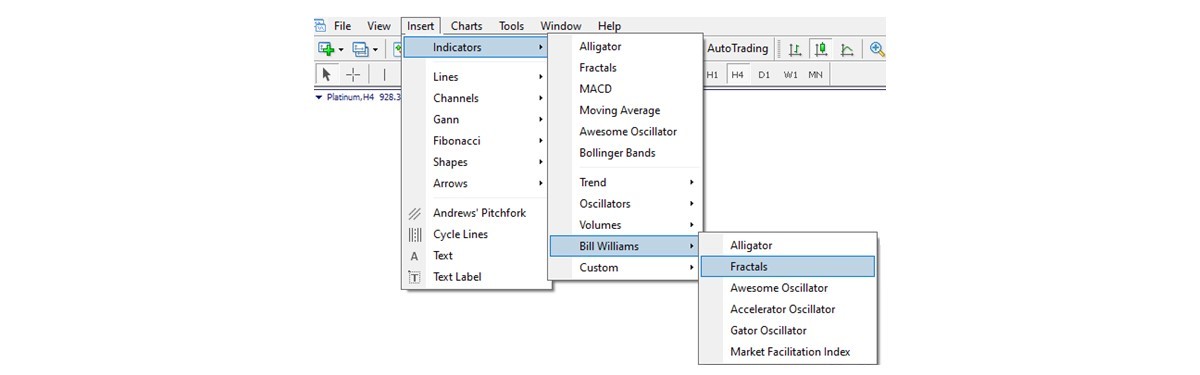
Es gibt zwei Möglichkeiten, Fraktale auf dem Chart zu finden.
Die erste - manuell. Sie müssen nur die folgenden Informationen lesen und jedes Fraktal in einem Diagramm identifizieren können, entsprechend der Reihenfolge der Kerzen, die zur Bildung eines Fraktals erforderlich sind.
Die zweite - klicken, um den Fraktalindikator auf dem Chart wiederzugeben. Wie man das macht, sehen Sie im nächsten Bild.
Struktur
Ein Fraktal ist eine Folge von fünf kompletten Kerzen. Es kann entweder bullish (abwärts) oder bearish (aufwärts) sein.
Sie werden eine kleine Schwierigkeit bei der Namensgebung im Vergleich zur üblichen Methodik sehen: Bullen bedeutet normalerweise Aufstieg und Baisse bezieht sich normalerweise auf Rückgang in der Forex-Welt. Während Sie hier sind, sehen Sie, dass ein bullisches Fraktal auch ein Down-Fraktal ist und ein bearisches Fraktal ein Up-Fraktal ist. Kein Grund zur Sorge, es ist ganz einfach, wie Sie sehen werden, schauen wir uns das an.
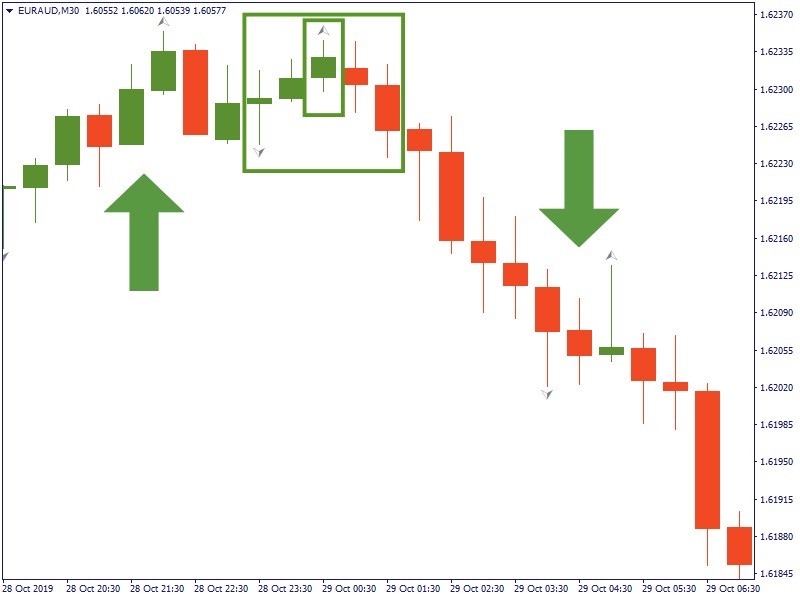
Um ein Fraktal von der kontinuierlichen Reihenfolge der Kerzen auf einem Chart zu trennen, müssen wir eine Pfeil-ähnliche Kombination von fünf Kerzen finden (obwohl sie nicht immer eindeutig einem Pfeil ähneln muss). Sobald wir die fünf Kerzen getrennt haben, schauen wir uns den mittleren an (den dritten, der sich in der Mitte befindet). Jetzt haben wir also eine zentrale Kerze mit zwei Flügeln: zwei Kerzen links und zwei rechts. Je nach relativer Position der zentralen Spitze der Kerze können wir unser Fraktal entweder als aufwärts (bearish) oder abwärts (bullish) identifizieren.
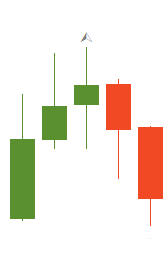
In einem bärischen Fraktal hat die zentrale Kerze das höchste Hoch, während diejenigen an den Seiten niedrigere Höhen haben. Das Fraktal als Ganzes zeigt nach oben, aber es geht einer Abwärtsbewegung voraus. Das ist der Grund, warum es als bearish bezeichnet wird. Sehen Sie das Bild unten.
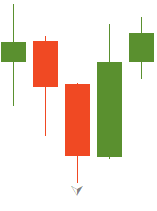
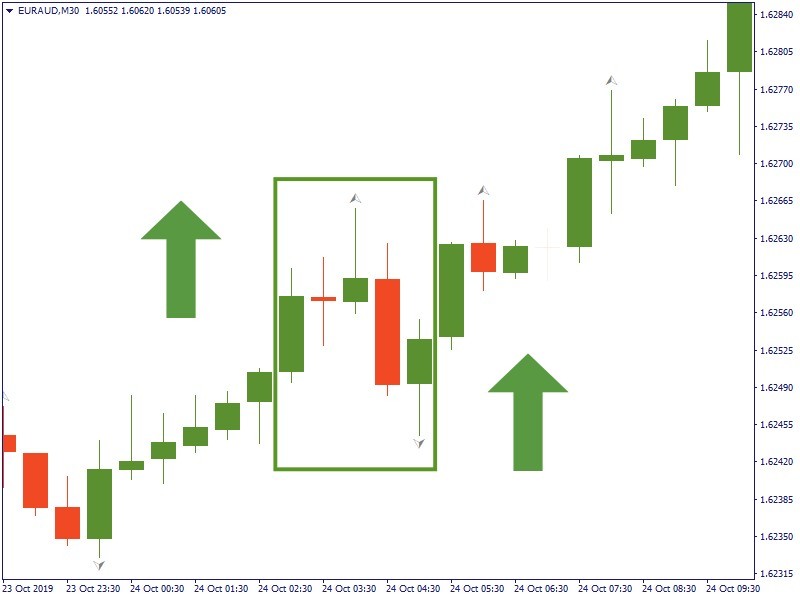
In einem bullischen Fraktal hat die zentrale Kerze das niedrigste Tief, mit den höchsten Tiefstwerten links und rechts, wie im nächsten Bild zu sehen ist. Da es oft vor der Umkehrung des Marktes nach oben kommt, erhielt es seinen Namen als bullisches Fraktal.
Nun, da wir wissen, wie man Fraktale auf einem Chart findet, sollten wir einige praktische Anwendungen für dieses Tool untersuchen.
Verwendungsmöglichkeiten
Möglichkeiten der Kombination
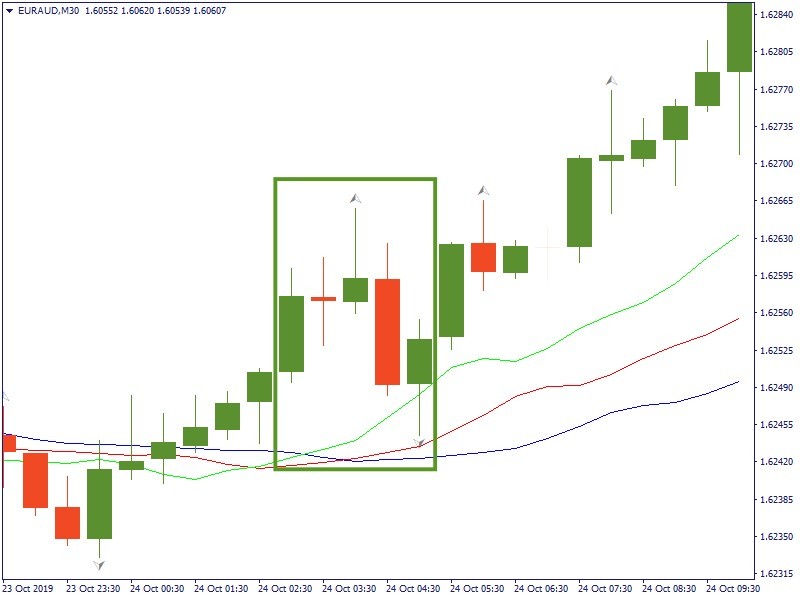
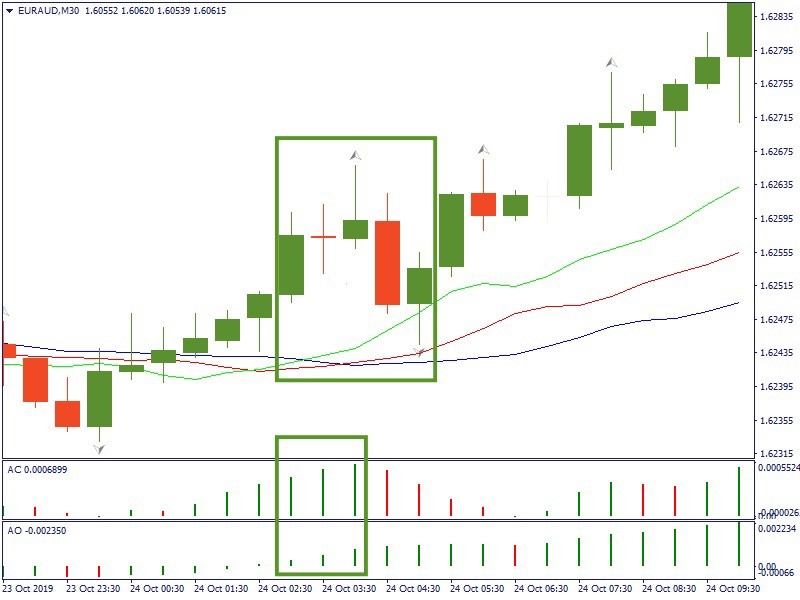
Es ist immer besser, mehrere Indikatoren im Einsatz zu haben, die sich gegenseitig ergänzen, anstatt sich nur auf einen zu verlassen. Der Indikator Fraktale ist kein Ausschluss. Es kann genauso zuverlässig oder unzuverlässig sein wie jedes andere Tool, deshalb werden wir einen Blick darauf werfen, wie Sie es mit anderen Methoden kombinieren können.
Beachten Sie bitte
Es gibt mehrere Korrekturen, die ein Händler vornehmen muss, wenn er Fraktale verwendet.
Erstens, ein Fraktal-Indikator ist ein verzögerter Indikator. Bevor ein Fraktal seine Bildung beendet oder als verworfen gilt, kann sich ein Markt bereits deutlich bewegt haben. Daher ist es wichtig, eine zusätzliche Bestätigung durch andere Indikatoren zu erhalten.
Zweitens kann es viele Fraktale auf der Karte geben. Dies kann zu Verwirrung führen. Deshalb müssen Sie zuerst Ihre Handelsstrategie wählen oder entscheiden, auf welchem Fraktal Sie handeln möchten. Andernfalls kann das Ausprobieren der Verfolgungsgeschäfte auf jedem Fraktal zu Verlusten führen.
Und schließlich sind Fraktale zuverlässiger, wenn sie in höheren Zeiträumen eingesetzt werden. Allerdings wird es in einem solchen Zeitraum eine geringere Anzahl von Fraktalen geben. Umgekehrt werden in einem niedrigeren Zeitrahmen viele einzelne Fraktale gebildet, die aber eine geringere Zuverlässigkeit aufweisen.
Fazit
Bill Williams Fraktale ist ein interessanter Indikator mit einer gewissen Begründung dahinter und gehört zu den grundlegenden, die viele Händler in ihrem Handelsroutine verwenden. Es kann ein sehr gutes Element im System der Handelsinstrumente sein, um mögliche Marktbewegungen zu identifizieren und fundierte Handelsentscheidungen zu treffen. Verwenden Sie es vorsichtig, handeln Sie mit dem Trend, und Sie werden sicher.

Bill Williams ist der Schöpfer einiger der bekanntesten Marktindikatoren: Awesome Oscillator, Fraktale, Alligator und Gator.

Trend-Strategien sind gut - sie können in jedem Zeitrahmen und mit jedem Vermögenswert signifikant gute Ergebnisse liefern. Die Hauptidee der ADX-Trend-Strategie besteht darin, den Beginn des Trends zu erwischen.

Gegentrend-Strategien sind immer die gefährlichsten, aber auch die profitabelsten. Wir freuen uns, Ihnen eine exzellente Gegentrend-Strategie vorstellen zu können, die in jedem Markt und mit jedem Vermögenswert funktioniert.


Ihr Antrag wird akzeptiert.
Wir werden Sie in dem von Ihnen gewählten Zeitintervall anrufen
Nächste Rückrufwunsch für diese Telefonnummer wird verfügbar in 00:30:00
Wenn Sie ein dringendes Problem haben, kontaktieren Sie uns bitte per
Live-Chat
Interner Fehler. Bitte versuchen Sie später noch einmal