


Best Trade Ideas for April
I know we've had quite an amazing run these past few month, with over 78% accuracy in our trade ideas and sentiments, and thousands of pips in profits monthly...

Don’t waste your time – keep track of how NFP affects the US dollar!
Data Collection Notice
We maintain a record of your data to run this website. By clicking the button, you agree to our Privacy Policy.

Beginner Forex Book
Your ultimate guide through the world of trading.

Check Your Inbox!
In our email, you will find the Forex 101 book. Just tap the button to get it!
Risk warning: ᏟᖴᎠs are complex instruments and come with a high risk of losing money rapidly due to leverage.
70.72% of retail investor accounts lose money when trading ᏟᖴᎠs with this provider.
You should consider whether you understand how ᏟᖴᎠs work and whether you can afford to take the high risk of losing your money.
Warning! Old version of the browser!
Press one of the icons below to proceed to the official website of the developer and download the latest version of your browser.

Online Forex broker
Information is not investment advice
EUR/GBP Technical Analysis
The Backdrop
The EUR/GBP pair has been steadily rising since May 6th as the uncertain political backdrop inside the United Kingdom continued to hurt the trading sentiment towards the British pound currency. The traditionally slow-moving currency pair turned technically bullish after breaking above its 200-day moving average, May 22nd.
Since firming above its 200-day moving average the EUR/GBP pair found advanced to its highest trading level since January 16th this year and eventually met strong technical resistance from the 0.8874 level towards the end of last week.
Technical Outlook
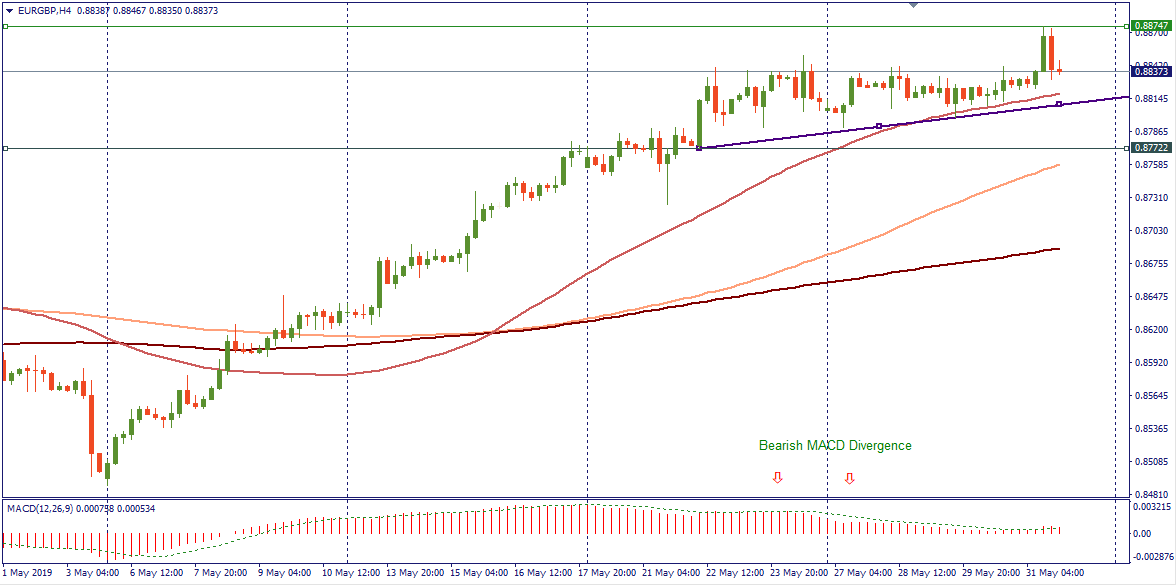
H4 Time Frame
The four-hour time frame is currently showing the presence of bearish MACD price divergence, which currently extends down towards the 0.8772 level. The large bearish reversal candle on the four-hour time frame suggests we may now be seeing this bearish divergence starting to be reversed.
Traders should also consider the EUR/GBP pair’s 200-period moving average on the four-hour time frame around the 0.8687 level. Price has traded above the 200-period MA since early May, sustained weakness below the 0.8772 may signal additional near-term weakness, with the 200-period average the major support level to watch on the four-hour time frame EUR/GBP pair.
Daily Time Frame
The daily time frame is showing that a possible inverted head and shoulders pattern is taking shape, with the EUR/GBP pair now testing the neckline of the pattern around the 0.8839 level. The bullish pattern has an upside projection of just under four hundred pips. Trader should expect the pair to hold a strong short-term bullish bias while price continues to trade above the 0.8839 level.
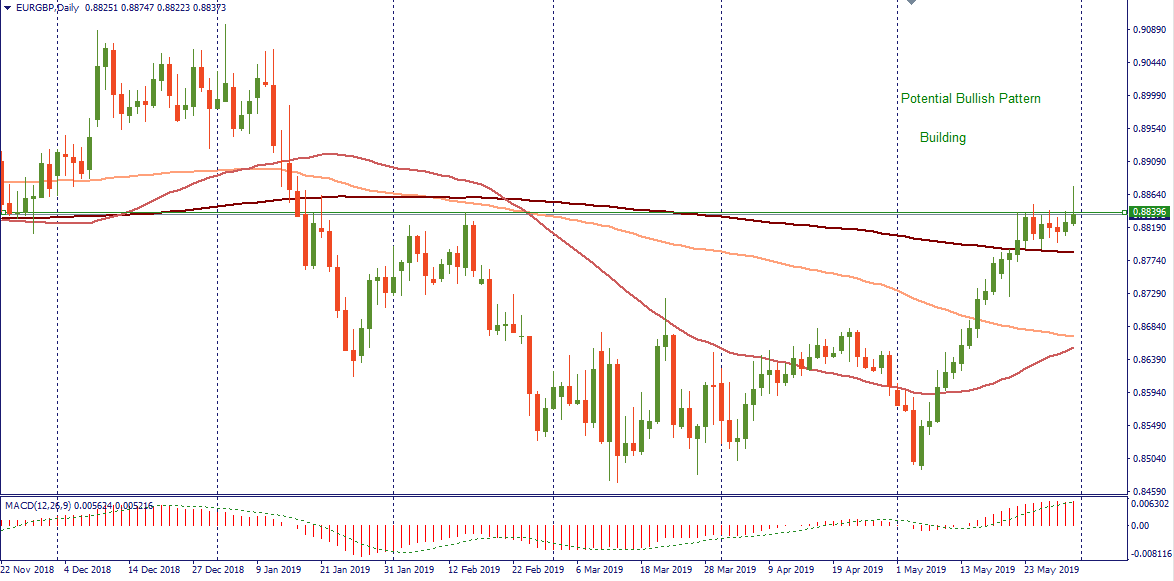
Key technical resistance above the May monthly trading high is found at the January 15th swing-high, at 0.8985, and the January 3rd swing-high, at 0.9096. To the downside, the EUR/GBP pair’s 200-day moving average, at 0.8785, is the most prominent technical support level to watch if sellers start to take control of price. Key support below comes from the 100-day and 50-day moving averages, at 0.8671 and 0.8655.
I know we've had quite an amazing run these past few month, with over 78% accuracy in our trade ideas and sentiments, and thousands of pips in profits monthly...

Futures for Canada's main stock index rose on Monday, following positive global markets and gains in crude oil prices. First Citizens BancShares Inc's announcement of purchasing the loans and deposits of failed Silicon Valley Bank also boosted investor confidence in the global financial system...

Investor confidence in the global financial system has been shaken by the collapse of Silicon Valley Bank and Credit Suisse. As a result, many are turning to bearer assets, such as gold and bitcoin, to store value outside of the system without...

eurusd-is-falling-what-to-expect-from-the-future-price-movement

Greetings, fellow forex traders! Exciting news for those with an eye on the Australian market - the upcoming interest rate decision could be good news for Aussies looking to refinance or take out new loans. The Mortgage and Finance Association Australia CEO, Anja Pannek, has...

Hold onto your hats, folks! The Japanese yen took a nosedive after the Bank of Japan (BOJ) left its ultra-loose policy settings unchanged, including its closely watched yield curve control (YCC) policy. But wait, there's more! The BOJ also removed its forward guidance, which had previously pledged to keep interest rates at current or lower levels. So, what's the scoop? Market expectations had been subdued going into the meeting, but some were still hoping for tweaks to the forward guidance to prepare for an eventual exit from the bank's massive stimulus


Your request is accepted.
We will call you at the time interval that you chose
Next callback request for this phone number will be available in 00:30:00
If you have an urgent issue please contact us via
Live chat
Internal error. Please try again later