


Williams’ Strategy
Bill Williams is the creator of some of the most popular market indicators: Awesome Oscillator, Fractals, Alligator, and Gator.

Don’t waste your time – keep track of how NFP affects the US dollar!
Data Collection Notice
We maintain a record of your data to run this website. By clicking the button, you agree to our Privacy Policy.

Beginner Forex Book
Your ultimate guide through the world of trading.

Check Your Inbox!
In our email, you will find the Forex 101 book. Just tap the button to get it!
Risk warning: ᏟᖴᎠs are complex instruments and come with a high risk of losing money rapidly due to leverage.
68.53% of retail investor accounts lose money when trading ᏟᖴᎠs with this provider.
You should consider whether you understand how ᏟᖴᎠs work and whether you can afford to take the high risk of losing your money.
Warning! Old version of the browser!
Press one of the icons below to proceed to the official website of the developer and download the latest version of your browser.

Online Forex broker
Information is not investment advice
Trading indices can be an unusual choice. However, it’s a great chance to learn more about the stock market and see the influence of stocks on the index. This article will tell you about an indicator created especially for trading indices- the Advance/Decline line.
The Advance/Decline line is a less popular technical indicator then other trading indicators such as the RSI, Stochastics, and MACD. While these other indicators are momentum based, that is aimed to determine strength or weakness of a stock, the A/D line indicator is unique in that it’s an indicator of market width showing how many buyers and sellers are participating in a stock market rally or decline.
This article will discuss the A/D indicator and its application in the stock market. Still, you can add the indicator to Metatrader and use it for all kinds of assets, not just stocks and indices.
The Advance/Decline line (ADL) is a technical indicator that displays the difference between the number of stocks going up and down on a daily basis. Mostly this indicator is used for stocks and indices trading. It shows a stocks’ participation in market rises or falls.
The most popular indices are capitalization-weighted indices. This type is also known as market value-weighted indices. The weight of a particular stock is determined by its total market capitalization. In such indices, stocks with larger market capitalizations have a higher weight, and any changes in their stock prices will have a greater impact on the performance of the index. For example, in S&P 500, Apple stock has the biggest weight.

Due to a large number of capitalization-weighted indices, such as the S&P 500, DJIA, and NASDAQ Composite, stocks with higher market caps will disproportionately influence index performance. Thus, the ADL shows what share of the index’s stocks participate in the market direction.
For example, if a capitalization-weighted stock index rose by 3%, it would be important for traders to know two things. First, it’s important to understand whether the increase in the index was due to an increase in the majority stocks. Second, one has to know whether the increase in the index was due to the exceptional performance of a company with a large weight in the index. A/D line can provide such information.
The A/D line is very easy to calculate and understand. In essence, the A/D line has three components. The first is advancing stocks, the second is declining stocks, and the third is previous net advances.
Stock gains refer to the total number of stocks within a market index that has risen in value over the last day. Stock decline refers to the total number of stocks within a market index that declined in price over the last day. And finally, previous net advances refer to the net sum of rising and falling stocks over the last day.
Let’s summarize:

Where:
Advancing Stocks refers to the number of stocks that increase in value daily;
Declining Stocks refers to the number of stocks that decline in value on a daily basis;
Previous Net Advances refer to the net sum of rising and falling shares on a daily basis.
A/D line indicator is not included in a standard indicator list, you need to install it by yourself. For that you need to do several steps:
There are two main signals that the A/D line gives. Let’s look through them.
First, traders can use it to confirm the strength of the trend. We have mentioned this before, but let’s repeat: when the A/D line moves up with the price action, it indicates a healthy uptrend.
There’s wide participation of stocks in an uptrend, and the price movement is expected to continue upwards. When a line moving down is combined with the declining price action, it’s a sign of a healthy downtrend. Prices are expected to continue moving down.
Below we see an example of an S&P 500 price chart shown with an A/D line that is used to confirm the health of an existing price trend.
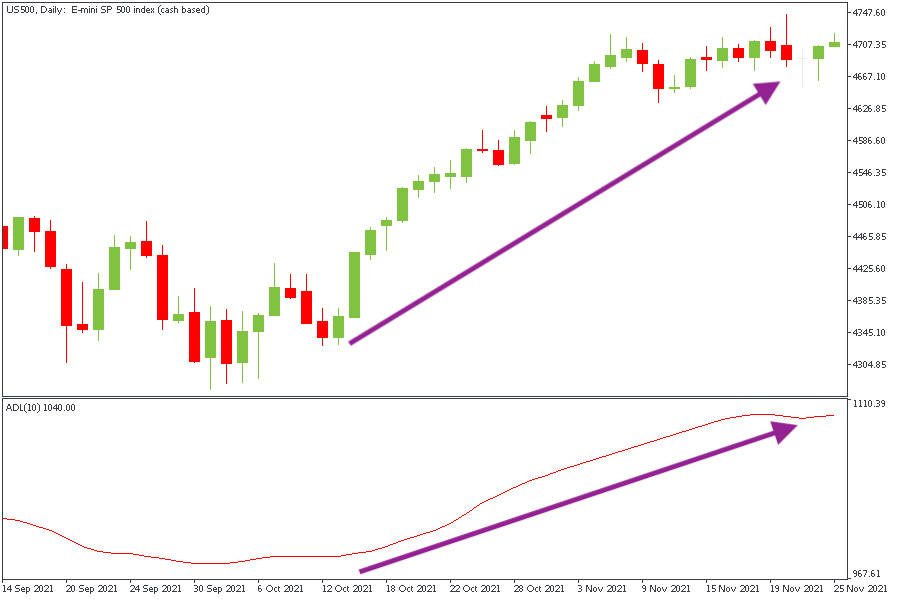
The price of the S&P500 and The Advance/Decline line move in the same uptrend direction. The A/D line confirms the price action by rising. This indicates the broad participation of stocks in this uptrend and provides some level of confirmation of the price trend.
Second, traders can use the A/D line to spot potential pivot points. At the moment of a potential reversal in an existing uptrend, we should expect the price action to make higher highs and the A/D line to make lower highs. This is called a bearish divergence between the price and the A/D line.
On the other hand, we can identify a potential reversal in an existing downtrend by studying the price chart and looking for swing lows that are gradually lowering while the A/D line is making higher lows. This is called a bullish divergence between the price and the A/D line.
Below you can find an example of the Nasdaq price chart shown with the A/D line used to identify a divergence between price and the A/D line.
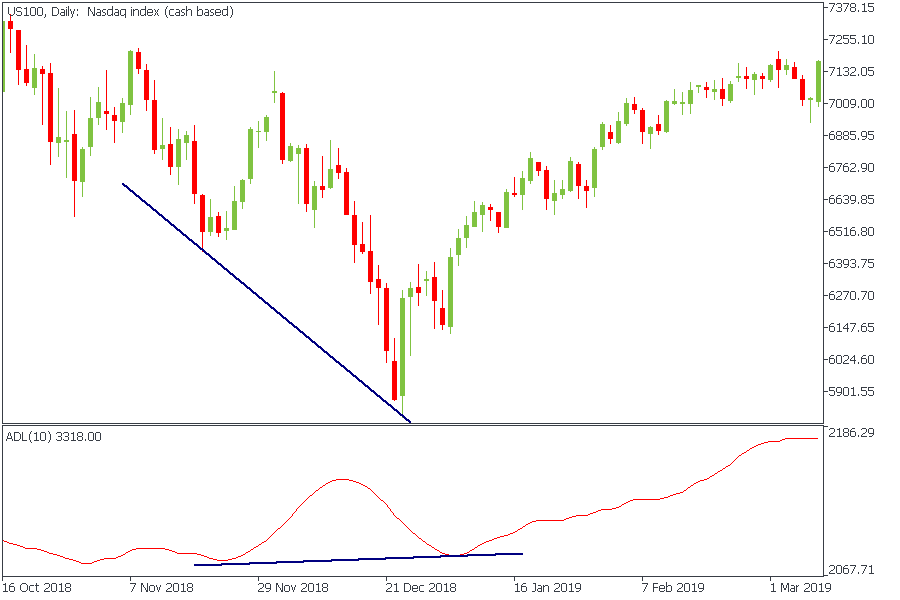
The NASDAQ price action created two major swing lows, with the second swing low lower than the first swing low. At the same time, the A/D line created a pattern in which the second low is higher than the first low. This creates a bullish divergence between the price and the A/D line.
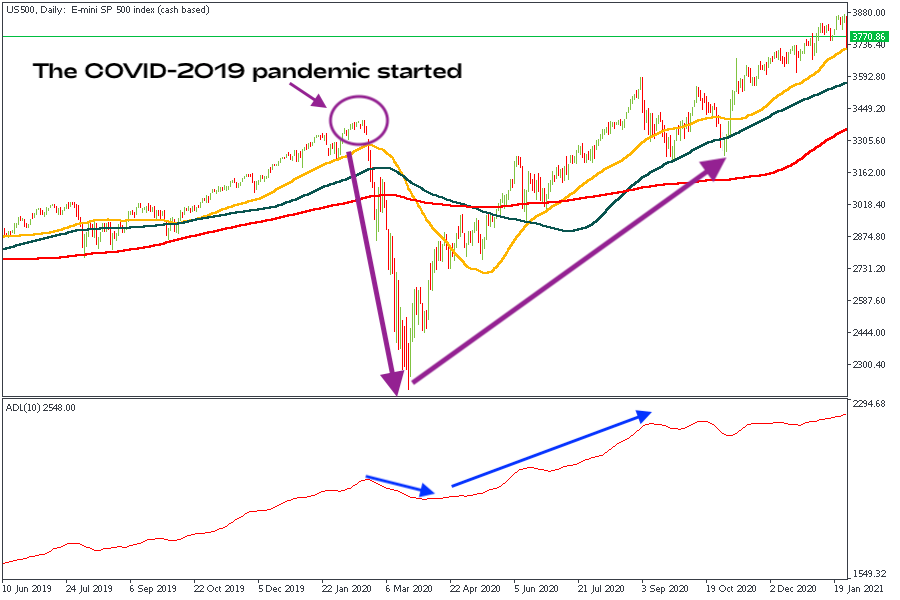
The chart below shows the A/D line for the S&P 500 Index. This chart shows the rate dropped sharply when the Covid pandemic was announced in 2020. This happened as the number of falling stocks and their volume increased in the S&P 500 index.
Shortly after that, the indicator rose as the number of shares rising, and their volume increased.
The A/D line doesn’t always give accurate data for NASDAQ stocks. This is because the NASDAQ often lists small, speculative companies, many of which end up failing or delisting. While stocks are delisted from the exchange, they remain at the previously calculated A/D line values. This affects future calculations that are added to the previous cumulative value. Because of this, the A/D line will sometimes fall for extended periods of time, even when the NASDAQ index price is rising.
Another thing to be aware of is that some indices are weighted by market cap. This means that the larger the company, the more influence it has on the movement of the index. The A/D line gives equal weight to all stocks. Thus, it’s a better indicator of medium-sized, small-cap, and mid-cap stocks, not fewer large-cap or mega-cap stocks.
The Advance/Decline line is a great indicator that can give valuable insights into price action within a major market index. The most reliable trading signal that the A/D line gives is the divergence signal. Traders should pay attention to a bullish or bearish divergence signal between the price action and the A/D line. These events often lead to a market reversal, which can be pretty profitable.
Legal disclaimer: The content of this material is a marketing communication, and not independent investment advice or research. The material is provided as general market information and/or market commentary. Nothing in this material is or should be considered to be legal, financial, investment or other advice on which reliance should be placed. No opinion included in the material constitutes a recommendation by Tradestone Ltd or the author that any particular investment security, transaction or investment strategy is suitable for any specific person. All information is indicative and subject to change without notice and may be out of date at any given time. Neither Tradestone Ltd nor the author of this material shall be responsible for any loss you may incur, either directly or indirectly, arising from any investment based on any information contained herein. You should always seek independent advice suitable to your needs.

Bill Williams is the creator of some of the most popular market indicators: Awesome Oscillator, Fractals, Alligator, and Gator.

Trend strategies are good - they may give significantly good results in any time frame and with any assets. The main idea of the ADX Trend-Based strategy is to try to catch the beginning of the trend.

Counter-trend strategies are always the most dangerous but also the most profitable. We are pleased to present an excellent counter-trend strategy for working in any market and with any assets.

eurusd-is-falling-what-to-expect-from-the-future-price-movement

Greetings, fellow forex traders! Exciting news for those with an eye on the Australian market - the upcoming interest rate decision could be good news for Aussies looking to refinance or take out new loans. The Mortgage and Finance Association Australia CEO, Anja Pannek, has...

Hold onto your hats, folks! The Japanese yen took a nosedive after the Bank of Japan (BOJ) left its ultra-loose policy settings unchanged, including its closely watched yield curve control (YCC) policy. But wait, there's more! The BOJ also removed its forward guidance, which had previously pledged to keep interest rates at current or lower levels. So, what's the scoop? Market expectations had been subdued going into the meeting, but some were still hoping for tweaks to the forward guidance to prepare for an eventual exit from the bank's massive stimulus


Your request is accepted.
We will call you at the time interval that you chose
Next callback request for this phone number will be available in 00:30:00
If you have an urgent issue please contact us via
Live chat
Internal error. Please try again later