Engulfing
Engulfing
An engulfing chart pattern is a candlestick formation that usually appears before a trend reversal. This pattern consists of two candlesticks, the first of which is smaller and is completely “engulfed” by the second one. Engulfing patterns are easier to spot on a chart, and they can help traders find the best moment to enter the market.
In this article you will learn about bullish and bearish engulfing patterns, what the so-called last engulfing pattern is and how you can use it, and the main pros and cons of using engulfing patterns in trading.
Bullish engulfing pattern
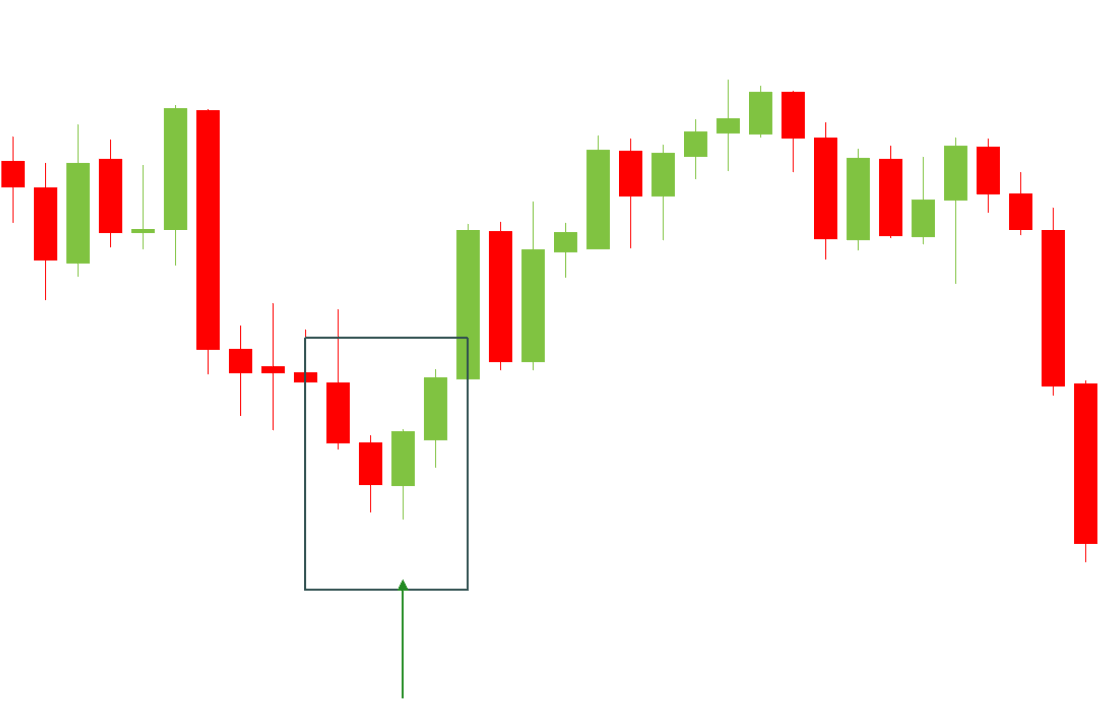
A bullish engulfing pattern is a type of engulfing candlestick pattern that occurs during a downtrend and signals a potential reversal of price movement and the beginning of an uptrend.
A bullish engulfing pattern consists of two candlesticks.
The first candlestick of the formation is a red candlestick, meaning that an asset’s price has closed below the opening price. The second candlestick, however, is green and shows that the price has opened lower than the preceding candle’s closing price and closed higher than the previous opening price. The body of the first candlestick is small while the body of the second candlestick is bigger and completely overlaps the first candlestick. This signals that, despite a steady downward movement of the price, the buyers start pushing back, causing the price of an asset to reverse and begin an upward movement.
Traders use a bullish engulfing pattern to discover the best time to open a long position. It’s also believed that a bullish engulfing pattern is more reliable if it’s preceded by several small candlesticks, indicating that the price has been at a standstill for a while before reversing. Bullish engulfing patterns can also act as trend confirmation indicators if they occur in an uptrend.
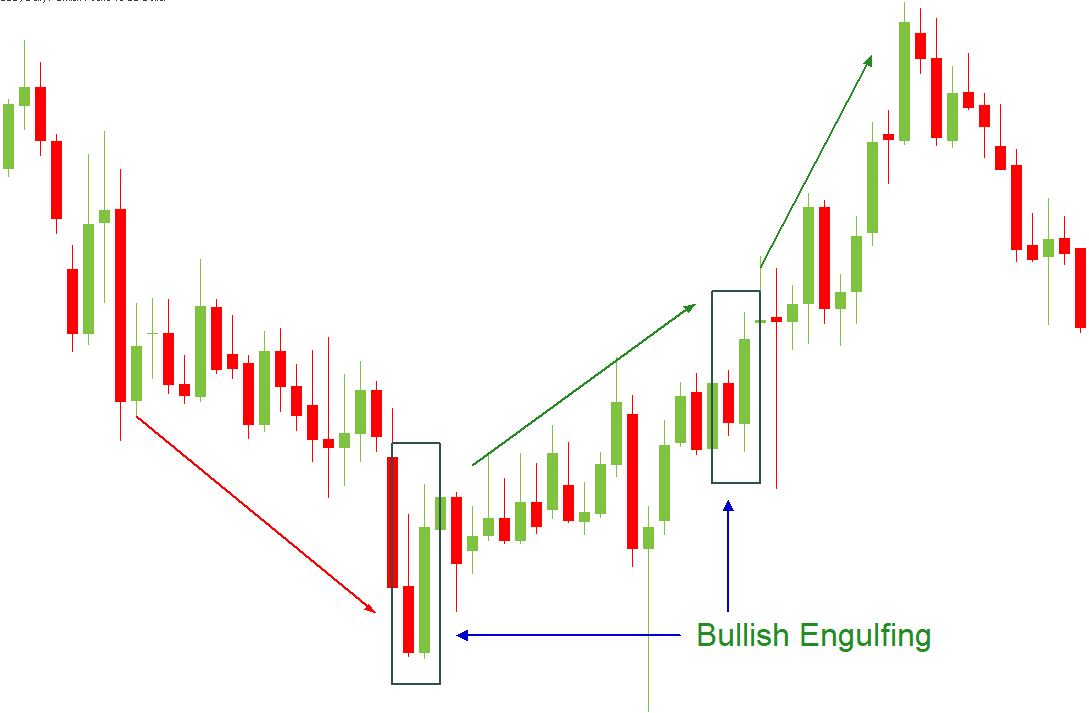
On the chart below you can see several bullish engulfing patterns. The first one occurred after a longer downtrend, signaling a reversal in the price movement. The second bullish engulfing formed at a later date during an uptrend, confirming the continuation of the upward price movement.
Bearish engulfing pattern
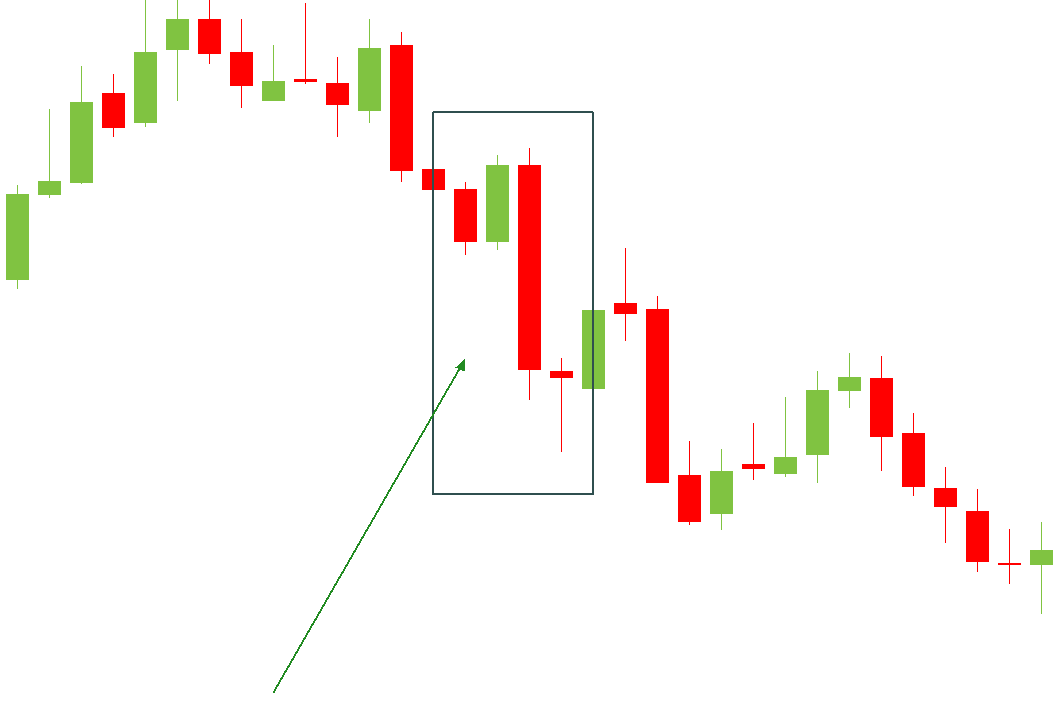
A bearish engulfing pattern is a complete opposite of the bullish engulfing. Bearish engulfing patterns occur during an uptrend and indicate a potential reversal to a downward movement.
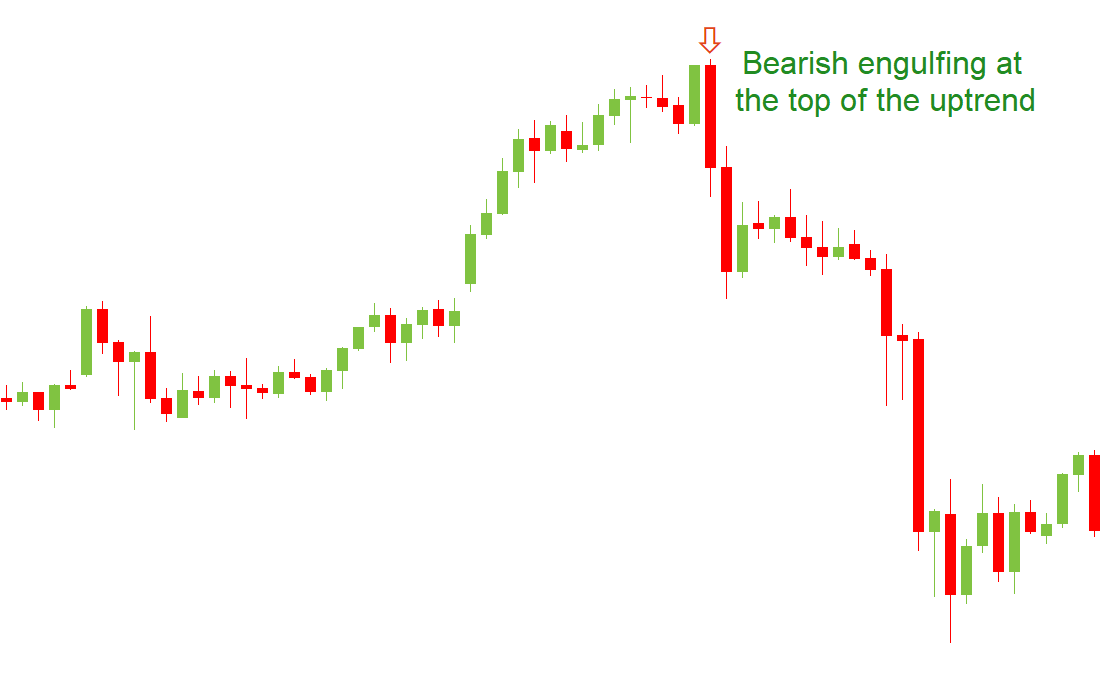
Bearish engulfing patterns also consist of two candlesticks. But in this case, the first candlestick is green while the second one is red. The second candlestick is bigger than the preceding one and completely engulfs it, showing that the sellers have overtaken the market and started to push the prices down.
Traders use this pattern to find the best moment to sell the assets they currently hold. A bearish engulfing is more reliable within steady trends; in choppy markets a bearish engulfing has less significance and can’t be relied on for long-term decisions.
This chart illustrates a classic bearish engulfing pattern. You can see how after a steady uptrend a small green candlestick is suddenly engulfed by a large red candlestick, after which the trend immediately gets reversed and begins its descent.
Last engulfing pattern
Another engulfing pattern, though less frequent, is a last engulfing pattern. This pattern has two variants: a last engulfing bottom and a last engulfing top.
A last engulfing bottom occurs at the bottom of a downtrend. This pattern consists of a smaller green candlestick that is followed by a bigger engulfing red candlestick. Note that unlike the previously mentioned patterns, a last engulfing bottom is preceded by red candlesticks. This pattern can either signal a bullish reversal of a trend or the continuation of the bearish trend, so it’s better to wait for a confirmation of the reversal before making any moves.
A last engulfing top is a complete opposite and appears at the top of an uptrend. It includes a red candlestick with a bigger green candlestick following it. The pattern is preceded by several green candlesticks. This pattern also requires a confirmation of the reversal, so don’t rush into any decisions if you find it on the chart.
Advantages of engulfing patterns
- They are easy to find and interpret. If you see a big candlestick that is different in color from the previous smaller ones, you can intuitively guess that it signals a change in price movement direction. Engulfing patterns stand out among other candlesticks on a chart, so even a beginner can spot them and use them to his or her advantage.
- They can be used with other indicators and tools. Engulfing patterns can be used by traders who already used other tools and need additional confirmation of a supposed trend reversal.
- They are relatively accurate. Engulfing patterns have a good track record when it comes to forecasting trend reversals, so they’re generally considered quite reliable.
Disadvantages of engulfing patterns
However, nothing can be 100% accurate. In choppy markets engulfing patterns won’t be of much use. Besides, the second candlestick of an engulfing pattern can be quite big, which can mislead a trader when it comes to putting a price target or a Stop Loss.
Final thoughts
Engulfing patterns are one of the easiest-to-spot trend reversal candlestick patterns. They are a great tool to find the best time to enter the market, especially for novice traders. Engulfing patterns are usually pretty accurate, but it’s still useful to apply other methods and indicators to make successful trading decisions.
FAQ
What is a bullish engulfing candle?
A bullish engulfing candlestick pattern is a chart pattern that occurs at the bottom of a downtrend and signals a potential reversal of the price movement. This pattern consists of a smaller red candlestick and a bigger green one that overlaps the preceding candlestick and signals the start of the bullish reversal.
What is a bearish engulfing candle?
A bearish engulfing candlestick is a chart pattern that appears at the top of an uptrend and signals a potential reversal of the current trend. A bearish engulfing includes two candlesticks: a smaller green candle and a bigger red candle that engulfs the preceding element and signals the beginning of a new bearish trend.
What is an engulfing candle?
Engulfing candlesticks are chart patterns that appear before a trend reversal. Engulfing patterns consist of two candlesticks where the second candlestick is bigger than the first one and completely engulfs it.
2022-12-29 • Updated


