


Crypto Market Changes The Trend
Happy Tuesday, dear traders! Here’s what we follow:

Don’t waste your time – keep track of how NFP affects the US dollar!
Data Collection Notice
We maintain a record of your data to run this website. By clicking the button, you agree to our Privacy Policy.

Beginner Forex Book
Your ultimate guide through the world of trading.

Check Your Inbox!
In our email, you will find the Forex 101 book. Just tap the button to get it!
Risk warning: ᏟᖴᎠs are complex instruments and come with a high risk of losing money rapidly due to leverage.
66.43% of retail investor accounts lose money when trading ᏟᖴᎠs with this provider.
You should consider whether you understand how ᏟᖴᎠs work and whether you can afford to take the high risk of losing your money.
Warning! Old version of the browser!
Press one of the icons below to proceed to the official website of the developer and download the latest version of your browser.

Online Forex broker
Information is not investment advice
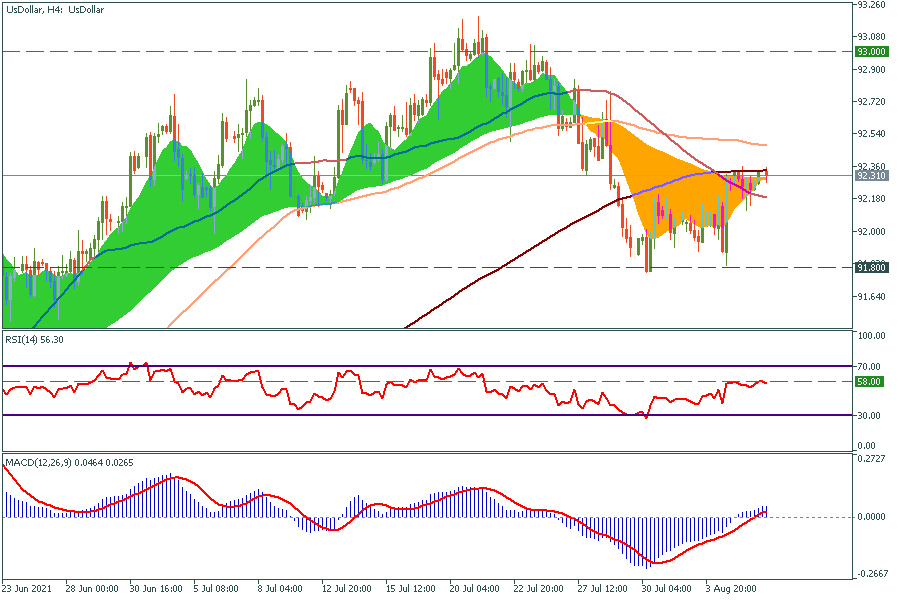
US dollar index tests the 200-period moving average. MA Ribbon indicator shows that the downtrend is almost over. The RSI indicator locates in the middle range and MACD tells the uptrend has just started. In the most likely scenario, after the US Nonfarm Payrolls report, the price will break through moving averages and head towards 93. On the flip side, if it will not, the closest support level is 91.8.
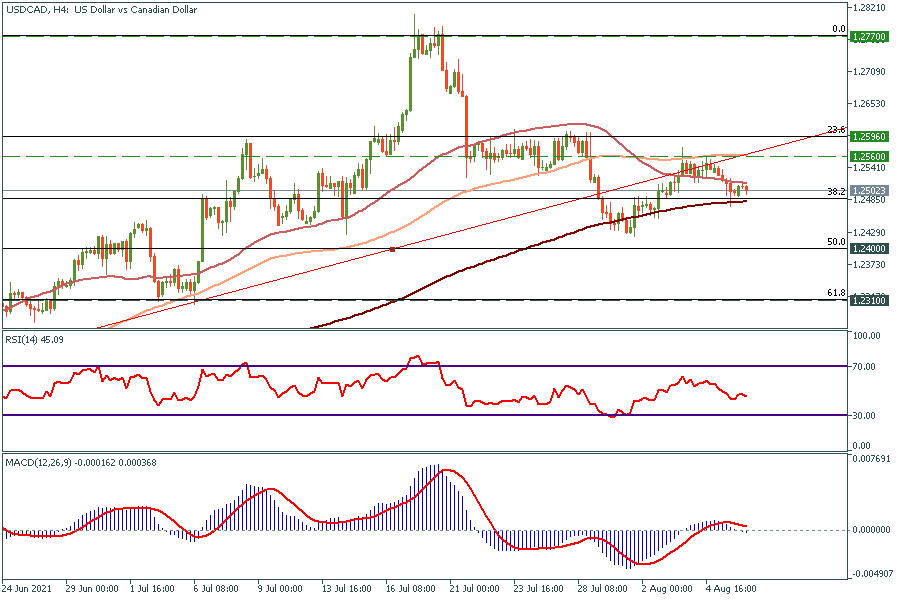
USD/CAD got squeezed between 50 and 200-period moving averages. In case the price holds above the 200-period moving average, it will head towards 1.256 (the 100-period MA) and 1.2596 (Fibonacci 23.6). In another scenario, it will meet 1.24 and 1.231 as these are 50 and 61.8 Fibonacci levels respectively.
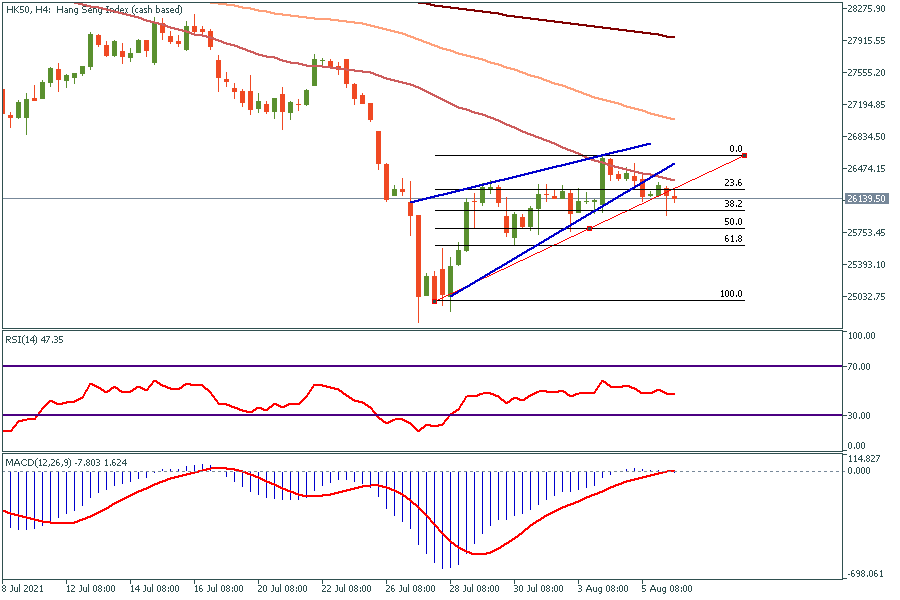
HK50. The price has fallen out of the rising wedge and now it is consolidating between 26,240 and 25,980, which are 23.6 and 38.2 Fibonacci levels respectively. It seems that the 38.2 Fibonacci is an extremely important support level as the price could not break it through for 3 times since August 3. That is why we suggest thinking about long trades if the price meets this level again. In this case, targets will be 26,240 and 26,600. Unfortunately, if HK50 breaks the 38.2 Fibonacci level, it might fall to 25,000 and draw a “double bottom” pattern.

Happy Tuesday, dear traders! Here’s what we follow:

Labor Market and Real Estate Market data was published yesterday. Markets are slowing down, so the economy is in recession. Today the traders should pay attention to the Retail sales in Canada.

What's going on with the US GDP? Economists think that the first quarter will be pessimistic. Let's check.

The most impactful releases of this week will fill the market with volatility and sharp movements.
Happy Tuesday, dear traders! Here’s what we follow:
Labor Market and Real Estate Market data was published yesterday. Markets are slowing down, so the economy is in recession. Today the traders should pay attention to the Retail sales in Canada.


Your request is accepted.
We will call you at the time interval that you chose
Next callback request for this phone number will be available in 00:30:00
If you have an urgent issue please contact us via
Live chat
Internal error. Please try again later