


Crypto Market Changes The Trend
Happy Tuesday, dear traders! Here’s what we follow:

Don’t waste your time – keep track of how NFP affects the US dollar!
Data Collection Notice
We maintain a record of your data to run this website. By clicking the button, you agree to our Privacy Policy.

Beginner Forex Book
Your ultimate guide through the world of trading.

Check Your Inbox!
In our email, you will find the Forex 101 book. Just tap the button to get it!
Risk warning: CFDs are complex instruments and come with a high risk of losing money rapidly due to leverage.
66.43% of retail investor accounts lose money when trading CFDs with this provider.
You should consider whether you understand how CFDs work and whether you can afford to take the high risk of losing your money.
Warning! Old version of the browser!
Press one of the icons below to proceed to the official website of the developer and download the latest version of your browser.

Online Forex broker
Information is not investment advice
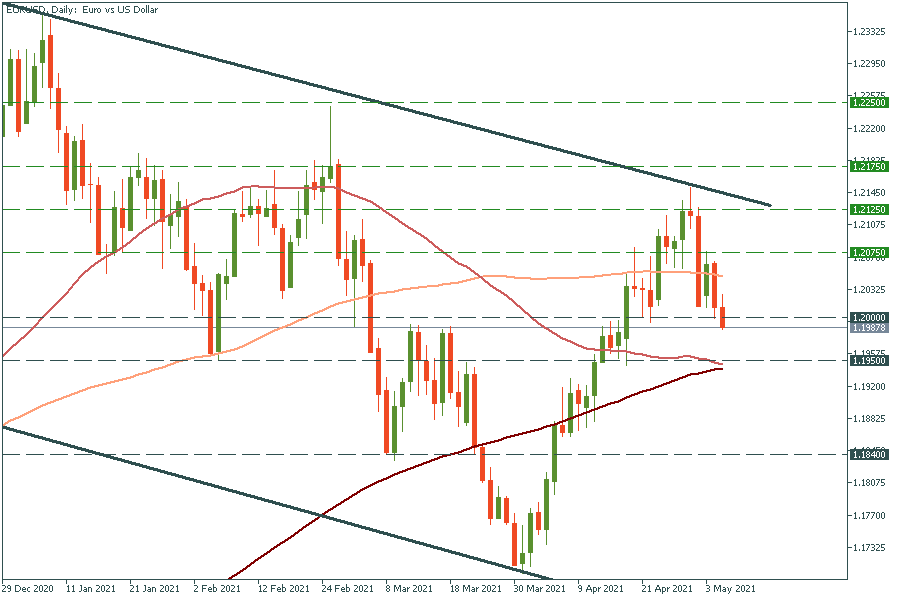
EUR/USD has just crossed the psychological level of 1.2000. This breakout will drive the pair down to the intersection of the 50- and 200- moving averages at 1.1950, where the falling should stop. On the other hand, the jump above Monday’s high of 1.2075 will drive the pair to the upper trend line of 1.2125.
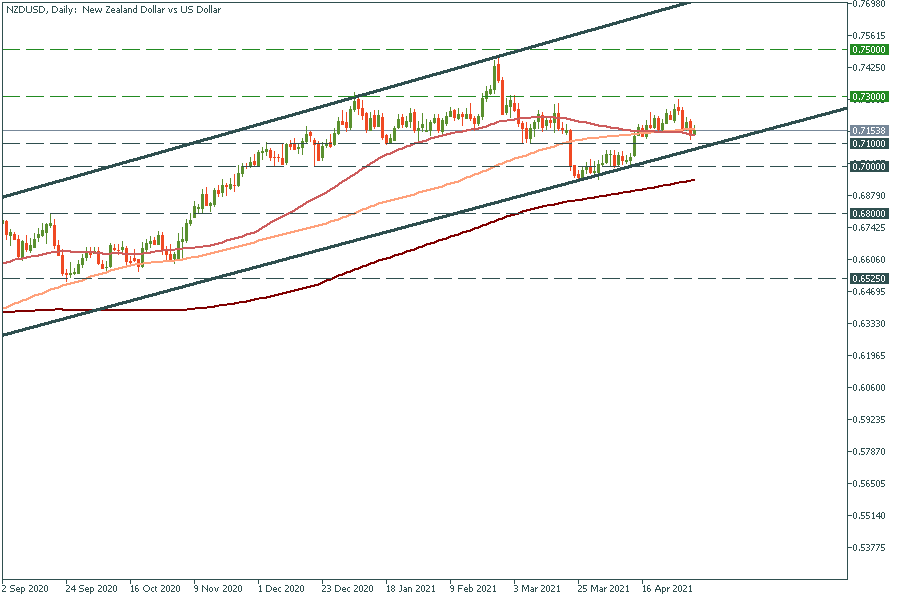
NZD/USD is trending up inside the ascending channel. If t manages to break April’s high of 0.7300, it may rally up further to the next round number of 0.7500. On the flip side, if it drops below the lower trend line at 0.7100, it may fall to the psychological level of 0.7000. This scenario is the least possible as it has failed to cross this support line for over a year.
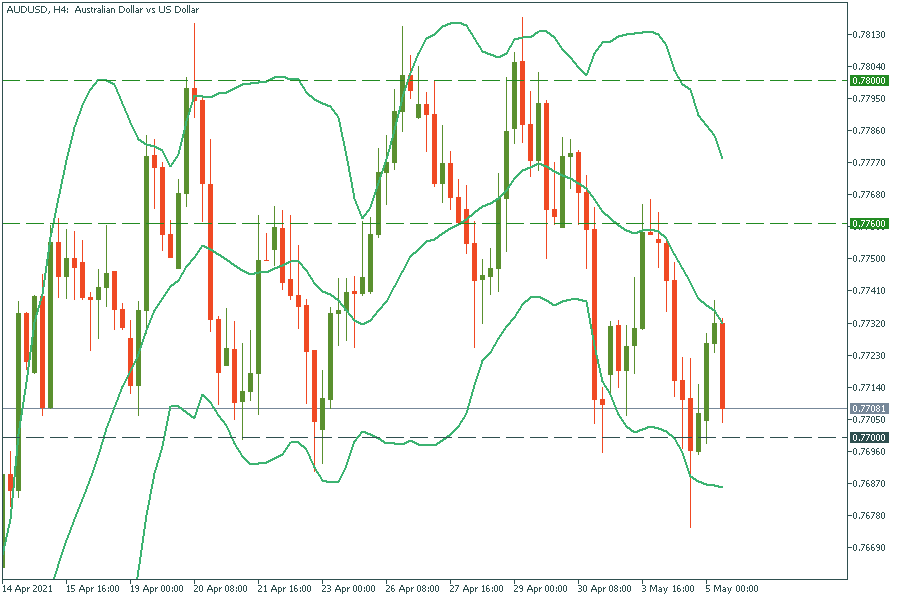
AUD/USD has been moving sideways between 0.7700 and 0.7800. Thus, this time it’s likely to bounce off the 0.7700 support again. If this is right, on the way up the pair will meet the resistance at Mondays’ high of 0.7760.
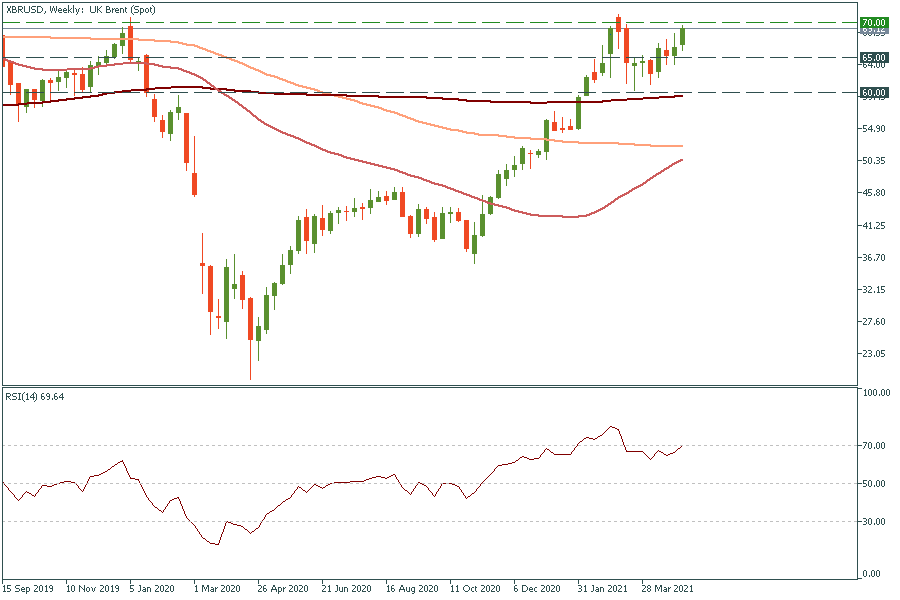
Finally, let’s discuss crude oil on the example of XBR/USD (UK Brent oil). If it manages to break above the $70.00 milestone, the way up to $75.00 will be open. However, it’s unlikely to rally for so long as on the weekly chart, the RSI indicator has approached the 70.00 level, signaling the asset is overbought. Therefore, we might expect the reverse down from $70.00. On the way down, the oil may struggle to cross support levels at the recent low of $65.00 and the 200-weekly moving average of $60.00.

Happy Tuesday, dear traders! Here’s what we follow:

Labor Market and Real Estate Market data was published yesterday. Markets are slowing down, so the economy is in recession. Today the traders should pay attention to the Retail sales in Canada.

What's going on with the US GDP? Economists think that the first quarter will be pessimistic. Let's check.

The most impactful releases of this week will fill the market with volatility and sharp movements.
Happy Tuesday, dear traders! Here’s what we follow:
Labor Market and Real Estate Market data was published yesterday. Markets are slowing down, so the economy is in recession. Today the traders should pay attention to the Retail sales in Canada.


Your request is accepted.
We will call you at the time interval that you chose
Next callback request for this phone number will be available in 00:30:00
If you have an urgent issue please contact us via
Live chat
Internal error. Please try again later