


Will the CPI Crash the USD?
The most impactful releases of this week will fill the market with volatility and sharp movements.

Don’t waste your time – keep track of how NFP affects the US dollar!
Data Collection Notice
We maintain a record of your data to run this website. By clicking the button, you agree to our Privacy Policy.

Beginner Forex Book
Your ultimate guide through the world of trading.

Check Your Inbox!
In our email, you will find the Forex 101 book. Just tap the button to get it!
Risk warning: CFDs are complex instruments and come with a high risk of losing money rapidly due to leverage.
66.43% of retail investor accounts lose money when trading CFDs with this provider.
You should consider whether you understand how CFDs work and whether you can afford to take the high risk of losing your money.
Warning! Old version of the browser!
Press one of the icons below to proceed to the official website of the developer and download the latest version of your browser.

Online Forex broker
Information is not investment advice
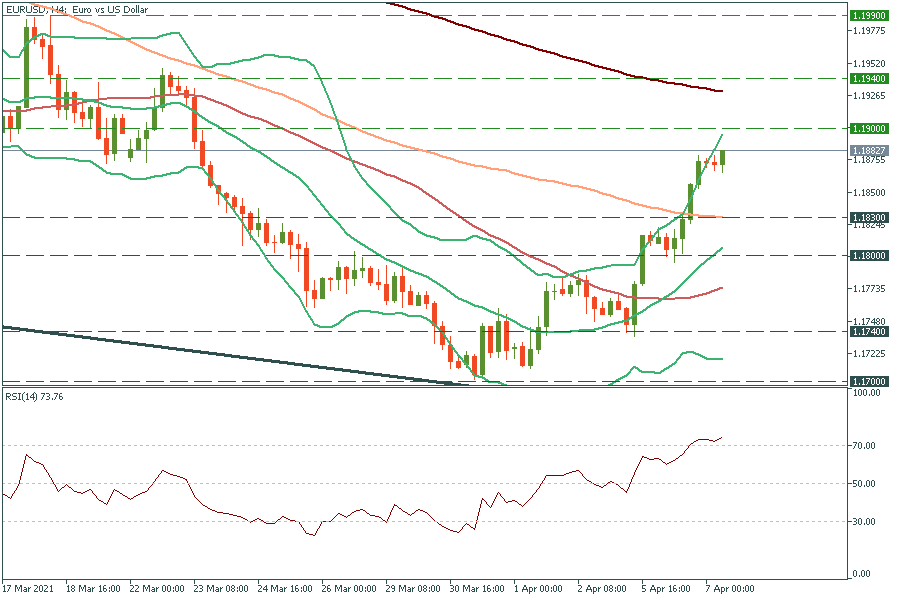
EUR/USD has approached the psychological mark of 1.1900. Technical indicators point to the soon reverse down: the RSI indicator rose above 70.00, the price is close to the upper line of Bollinger Bands, and on the daily chart there is the 200-day moving average just above the current price. Thus, the pair may fail to cross the resistance of 1.1900 and reverse down. Support levels are the 100-period moving average of 1.1830 and yesterday’s low of 1.1800.
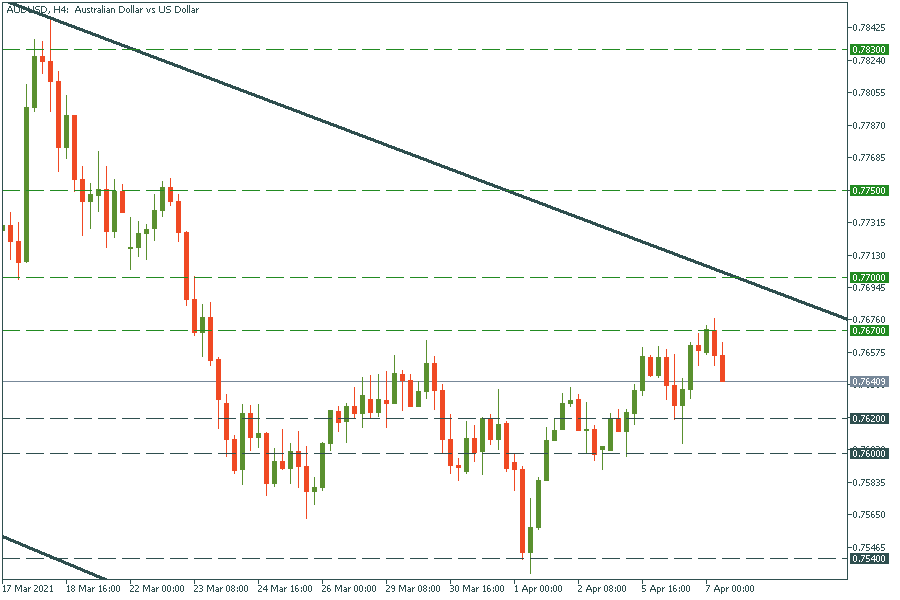
AUD/USD is moving in a descending channel in the long term. Since it is close to the upper trend line, it’s likely to reverse down soon. If it breaks yesterday’s low of 0.7620, the way down to the next support of 0.7600 will be open. On the flip side, if bulls take control and drag the price above the intraday high of 0.7670, it may jump higher to the next resistance of 0.7700.
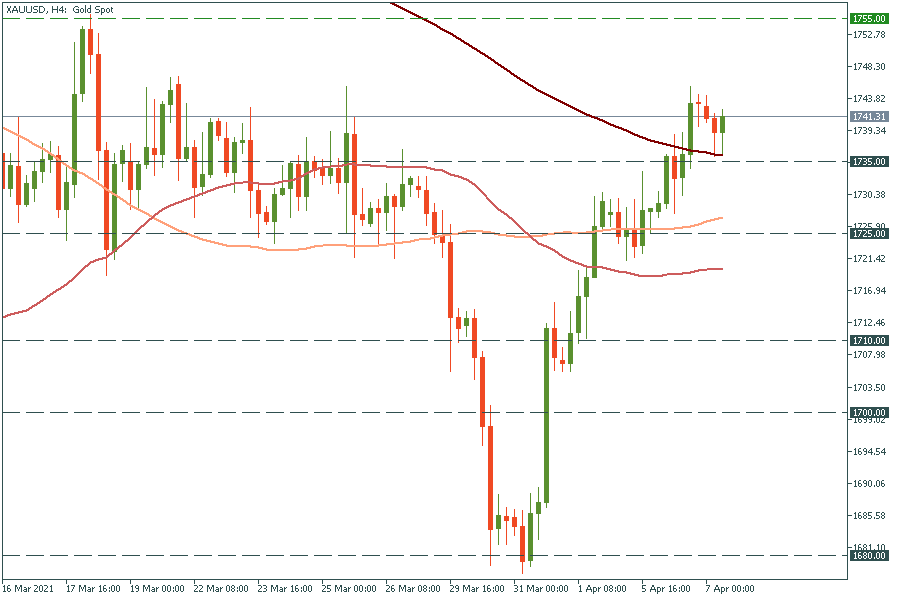
Gold is edging up and up. It has bounced off the 200-period moving average of $1755. Thus, the way up to the high of March 18 at $1755 is open. If it manages to break it, it may rally up further to the high of February 18 at $1790. In the opposite scenario, the move below the $1755 support will lead the yellow metal to the 100-period moving average of $1725.

The most impactful releases of this week will fill the market with volatility and sharp movements.

We prepared an outlook of major events of this week. Check it and be ready!

Here you'll find what awaits the market this week, from the CPI release to a possible gold plunge.
The most impactful releases of this week will fill the market with volatility and sharp movements.

Happy Tuesday, dear traders! Here’s what we follow:

Labor Market and Real Estate Market data was published yesterday. Markets are slowing down, so the economy is in recession. Today the traders should pay attention to the Retail sales in Canada.


Your request is accepted.
We will call you at the time interval that you chose
Next callback request for this phone number will be available in 00:30:00
If you have an urgent issue please contact us via
Live chat
Internal error. Please try again later