


Crypto Market Changes The Trend
Happy Tuesday, dear traders! Here’s what we follow:

Don’t waste your time – keep track of how NFP affects the US dollar!
Data Collection Notice
We maintain a record of your data to run this website. By clicking the button, you agree to our Privacy Policy.

Beginner Forex Book
Your ultimate guide through the world of trading.

Check Your Inbox!
In our email, you will find the Forex 101 book. Just tap the button to get it!
Risk warning: ᏟᖴᎠs are complex instruments and come with a high risk of losing money rapidly due to leverage.
70.72% of retail investor accounts lose money when trading ᏟᖴᎠs with this provider.
You should consider whether you understand how ᏟᖴᎠs work and whether you can afford to take the high risk of losing your money.
Warning! Old version of the browser!
Press one of the icons below to proceed to the official website of the developer and download the latest version of your browser.

Online Forex broker
Information is not investment advice
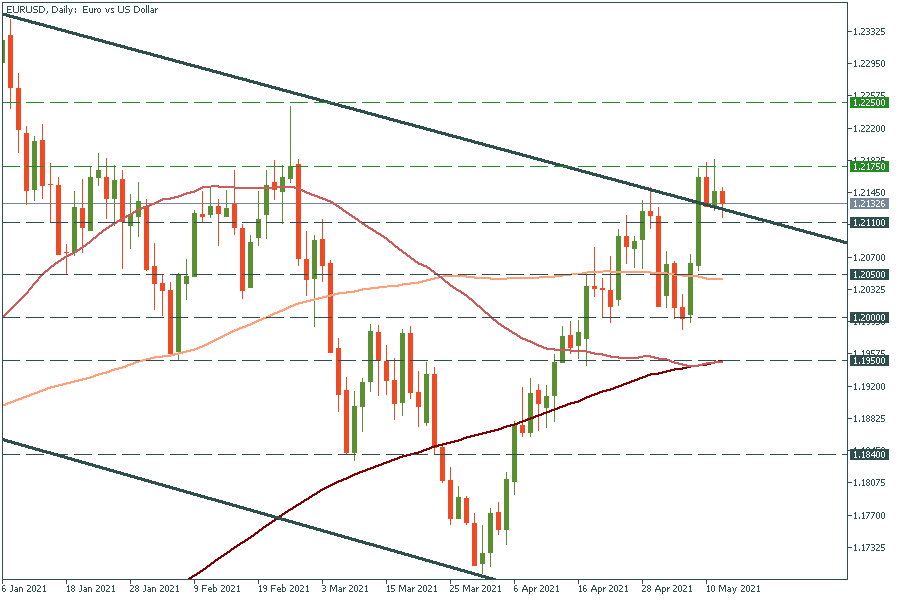
EUR/USD is trading sideways. The upper trend line of the channel has transformed from the resistance to the support level for the pair. If it breaks the recent high of 1.2175, the way up to the high of February 25 at 1.2250 will be open. However, if it drops below 1.2110, it may fall to the 100-day moving average of 1.2050.
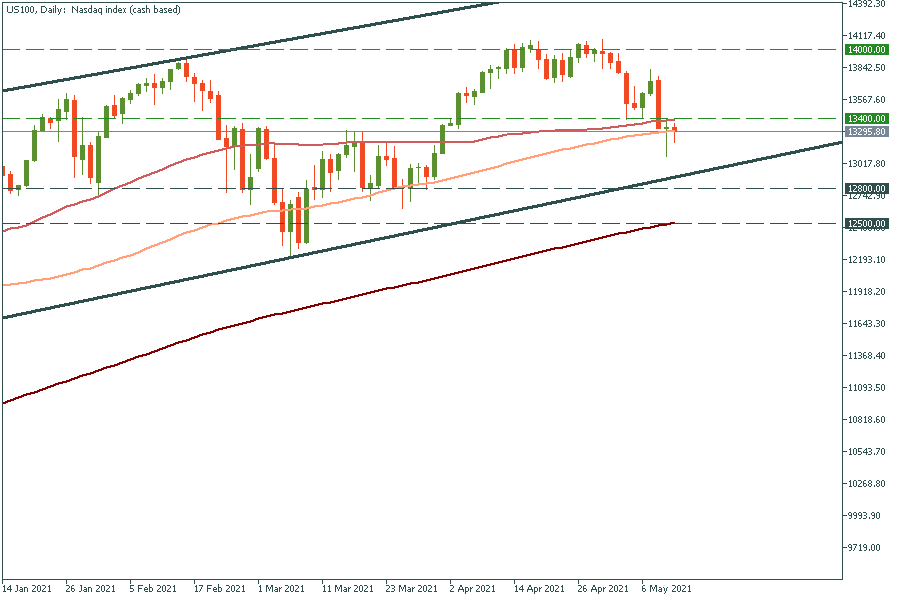
Nasdaq (US 100) dropped and approached the lower trend line near 13,000. It’s unlikely to cross this support level as it has failed to do so several times this and last year. Since it’s trading inside the ascending channel since August 2020, we might expect the tech stock index to keep moving up. If it breaks above the 50-day moving average of 13,400, the way up to the recent high of 13,750 will be open and then after some time to 14,000. Such broad indices as Nasdaq or S&P 500 always go up in the long term.
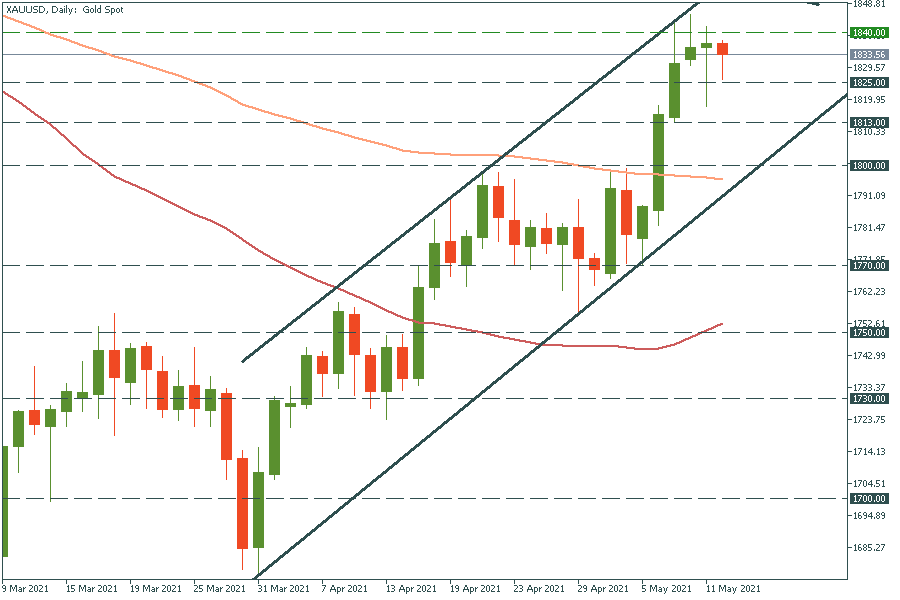
The decisive moment for gold is on the chart! On the weekly chart, there is a 50-week moving average just above the current price that stops gold from further rising. On the daily chart, there are resistance levels at the 200-day moving average and the upper trend line at $1850. If it finally manages to break them, the way up to $1875 will be open. Gold is viewed as a hedge against inflation, that’s why if inflation hikes today, the metal may advance. Just in case, be aware of support levels at the recent lows of $1825 and $1813.

Happy Tuesday, dear traders! Here’s what we follow:

Labor Market and Real Estate Market data was published yesterday. Markets are slowing down, so the economy is in recession. Today the traders should pay attention to the Retail sales in Canada.

What's going on with the US GDP? Economists think that the first quarter will be pessimistic. Let's check.

The most impactful releases of this week will fill the market with volatility and sharp movements.
Happy Tuesday, dear traders! Here’s what we follow:
Labor Market and Real Estate Market data was published yesterday. Markets are slowing down, so the economy is in recession. Today the traders should pay attention to the Retail sales in Canada.


Your request is accepted.
We will call you at the time interval that you chose
Next callback request for this phone number will be available in 00:30:00
If you have an urgent issue please contact us via
Live chat
Internal error. Please try again later