Happy Tuesday, dear traders! Here’s what we follow:

Don’t waste your time – keep track of how NFP affects the US dollar!
Data Collection Notice
We maintain a record of your data to run this website. By clicking the button, you agree to our Privacy Policy.

Beginner Forex Book
Your ultimate guide through the world of trading.
Check Your Inbox!
In our email, you will find the Forex 101 book. Just tap the button to get it!
Risk warning: ᏟᖴᎠs are complex instruments and come with a high risk of losing money rapidly due to leverage.
68.53% of retail investor accounts lose money when trading ᏟᖴᎠs with this provider.
You should consider whether you understand how ᏟᖴᎠs work and whether you can afford to take the high risk of losing your money.
Information is not investment advice
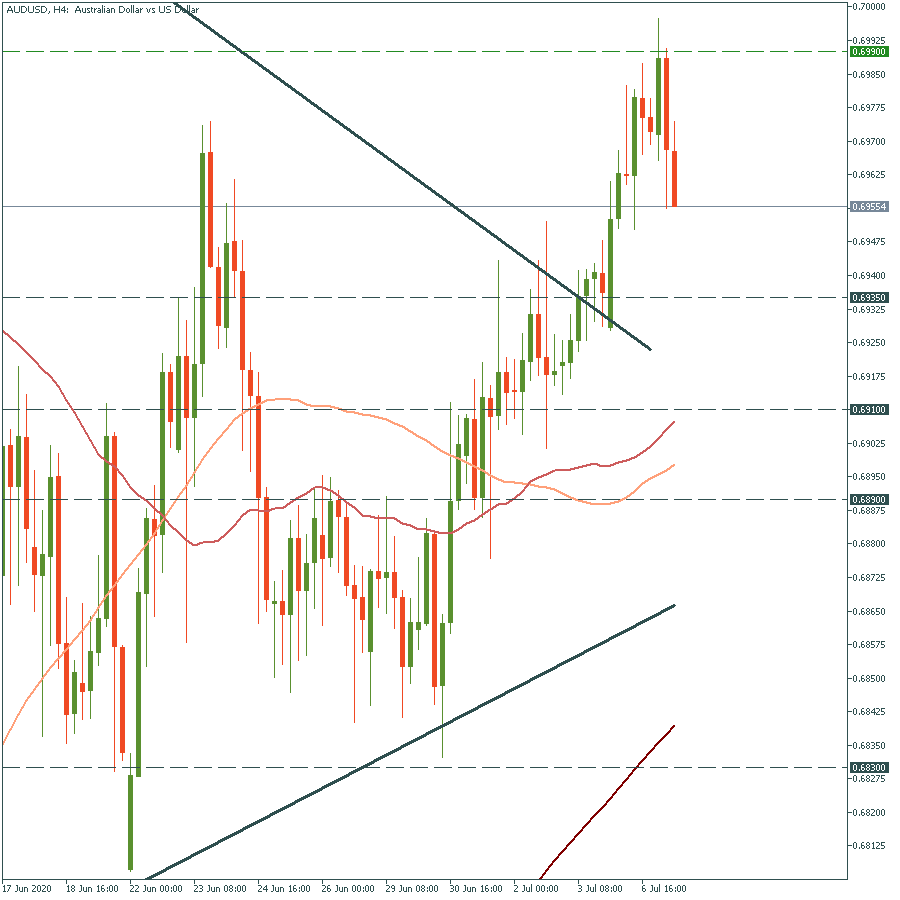
After the RBA statement, the Australian dollar reversed from the resistance at 0.6990 and slumped. It will meet the next support at 0.6935. If it breaks it down, it may fall deeper to the 50-day moving average at 0.6910. Resistance levels are at 0.6990 and 0.7015.

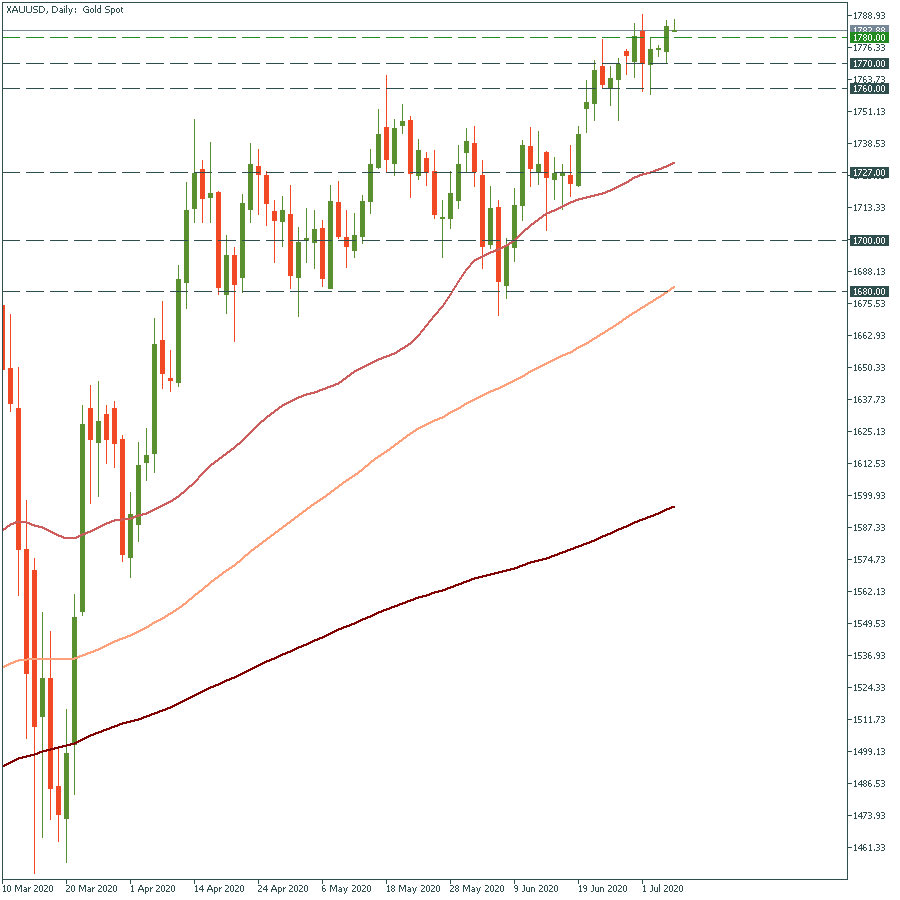
Let’s move on to gold. It caught the overall risk-off mood and gained on it. XAU/USD has just crossed the strong resistance at $1 780. It basically means it may reach soon $1 800 – the level that analysts widely expect. Support levels will be at $1 770 and $1 760.

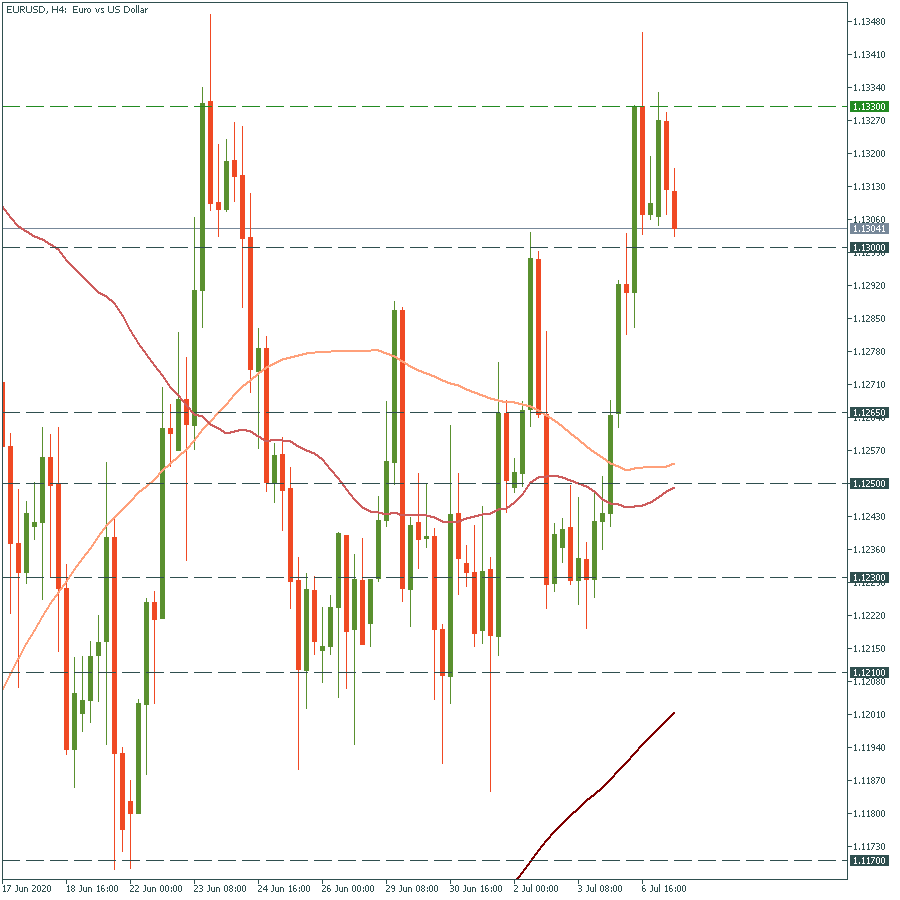
EUR/USD has just bounced back from the strong resistance at 1.330, that it has touched already once. Thus, it has formed a double top pattern, which is an extremely bearish signal. It will meet soon the support at 1.1300. If it manages to cross it, it will open doors towards the next support at the low of July 2 at 1.1265.

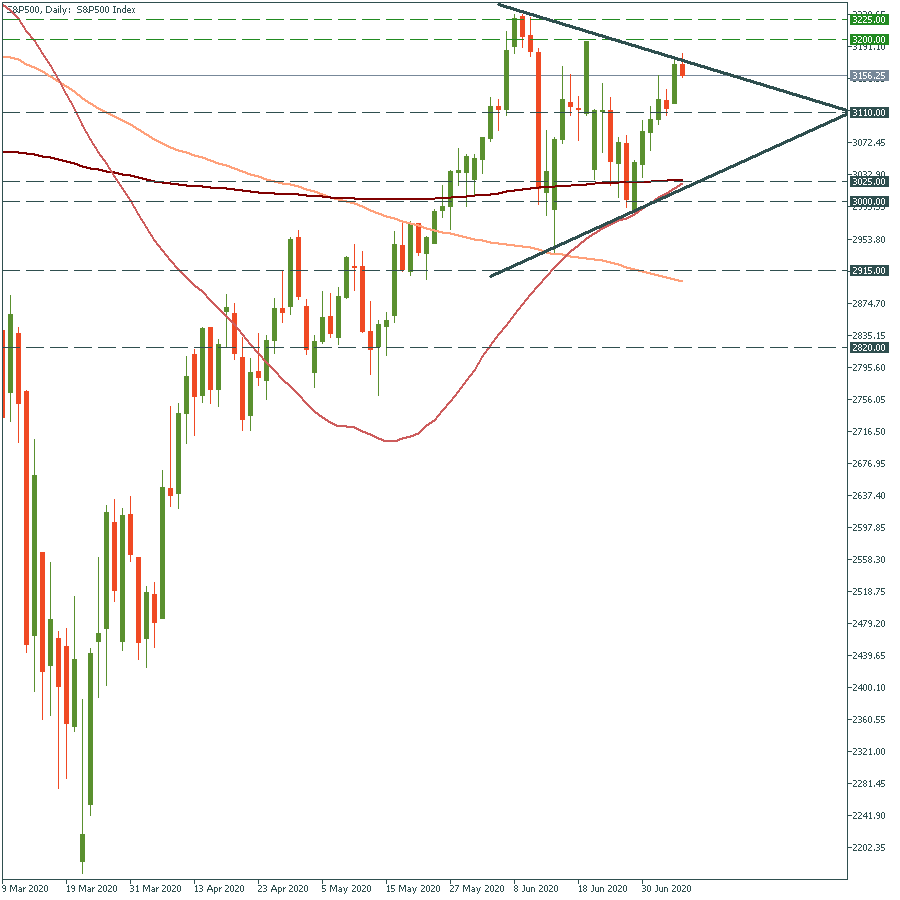
Finally, let’s have a look what’s happening with the S&P 500. It has been trading in a range between 3 000 and 3 225 for over a month. However, this range is narrowing, and we could easily draw a triangle. The stock index may fall to the support at 3 110 today. If it breaks it down, it may fall even deeper to the 200-day moving average at 3 025 and continue its zig-zag movement.


Happy Tuesday, dear traders! Here’s what we follow:

Labor Market and Real Estate Market data was published yesterday. Markets are slowing down, so the economy is in recession. Today the traders should pay attention to the Retail sales in Canada.

What's going on with the US GDP? Economists think that the first quarter will be pessimistic. Let's check.

The most impactful releases of this week will fill the market with volatility and sharp movements.

Happy Tuesday, dear traders! Here’s what we follow:

Labor Market and Real Estate Market data was published yesterday. Markets are slowing down, so the economy is in recession. Today the traders should pay attention to the Retail sales in Canada.
Your request is accepted.
We will call you at the time interval that you chose
Next callback request for this phone number will be available in 00:30:00
If you have an urgent issue please contact us via
Live chat
Internal error. Please try again later