

G20: what did the leaders decide?
The G20 summit took place in Bali, Indonesia, on November 2022…

Don’t waste your time – keep track of how NFP affects the US dollar!
Data Collection Notice
We maintain a record of your data to run this website. By clicking the button, you agree to our Privacy Policy.

Beginner Forex Book
Your ultimate guide through the world of trading.

Check Your Inbox!
In our email, you will find the Forex 101 book. Just tap the button to get it!
Risk warning: ᏟᖴᎠs are complex instruments and come with a high risk of losing money rapidly due to leverage.
66.43% of retail investor accounts lose money when trading ᏟᖴᎠs with this provider.
You should consider whether you understand how ᏟᖴᎠs work and whether you can afford to take the high risk of losing your money.
Warning! Old version of the browser!
Press one of the icons below to proceed to the official website of the developer and download the latest version of your browser.

Online Forex broker
Information is not investment advice
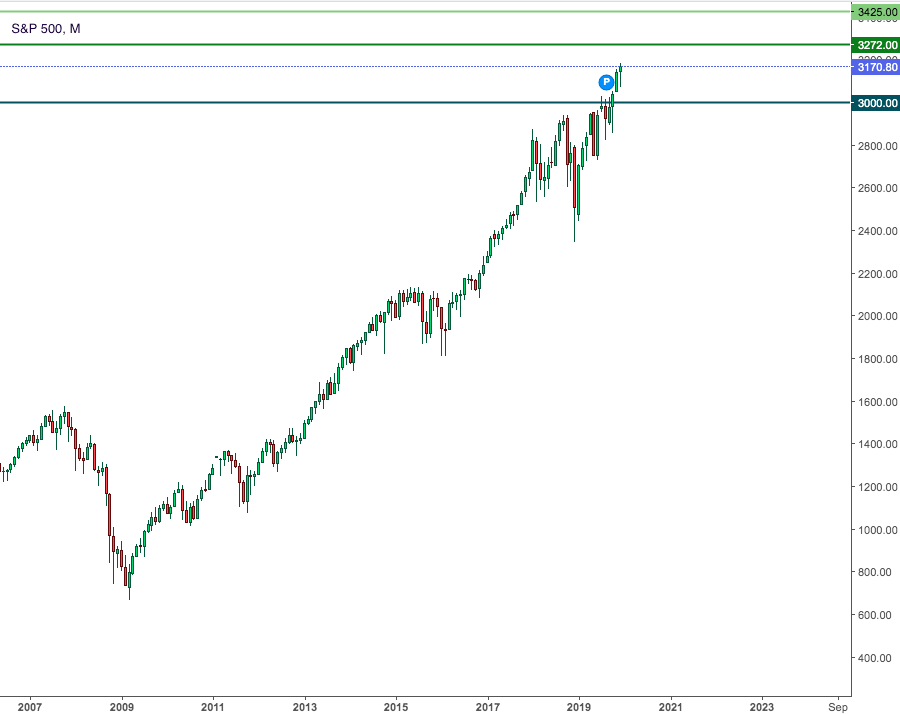
S&P 500 was a gainer in 2019 with a rally of more than 25% so far. It seems like the index may show the best performance since 2013 and the third-strongest annual gain in 19 years.
The surge is based on several factors. Among them are an accommodative monetary policy of the Federal Reserve, strong American economic data, waning risks of the recession, and rumors about the closer US-China trade truce.
Many industries of the S&P 500 showed a great performance. According to the Market Insider, the first one is the information technology with a performance of 40.9%. The highest-weighted holding is Microsoft. Communication services are on second place with a 28.7% performance and Facebook as a leader of the industry. Financials and its performance of 26.8% is the third top industry. Berkshire Hathaway Class B is the highest-weight holding. The next one is industrials and its 25.3% with Boeing being the leader. And finally, the real estate with 23.1% gain and American Tower as a leader.
The most important question of the year-end is whether the index is able to set new records or the pullback is unavoidable. December 15 will become a sticking point in the Sino-US trade dispute that may either push S&P 500 up or cause a rollback. The United States is due to implement 15% tariffs on Chinese export. If that happens, China will retaliate with 5 % and 10% levies. Such a scenario will lead to a risk-off sentiment that will pull the index down. If the deadlock is broken, S&P 500 will get a chance to meet new highs.
What levels to expect
According to the data by the CNBC, the maximum target for the index price in 2019 is $3,250 (Deutsche Bank). The minimum target is $2,550 (UBS). The medium level is $3,000.
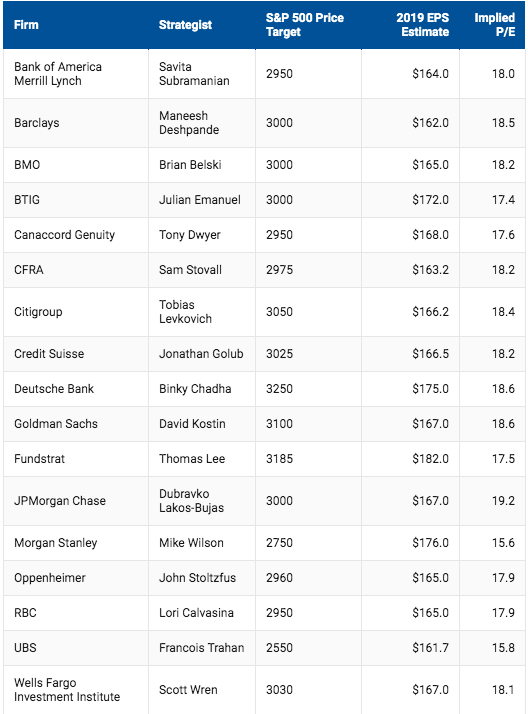
Source of the table: CNBC
However, the technical setup may show something different.
On the daily chart, the pair tested highs above $3,180. Up to now, it has been moving down. However, the fall may be limited. The further direction will depend on the tariffs’ outcome. In the case of the tariffs' implementation, the risk-off sentiment will pull the index down towards supports at $3,125, $3,091, and $3,070. If the market sentiment is supported by the trade truce, the S&P 500 will set new highs above $3,180. It has a long way towards the Deutsche Bank's projection of $3,250.
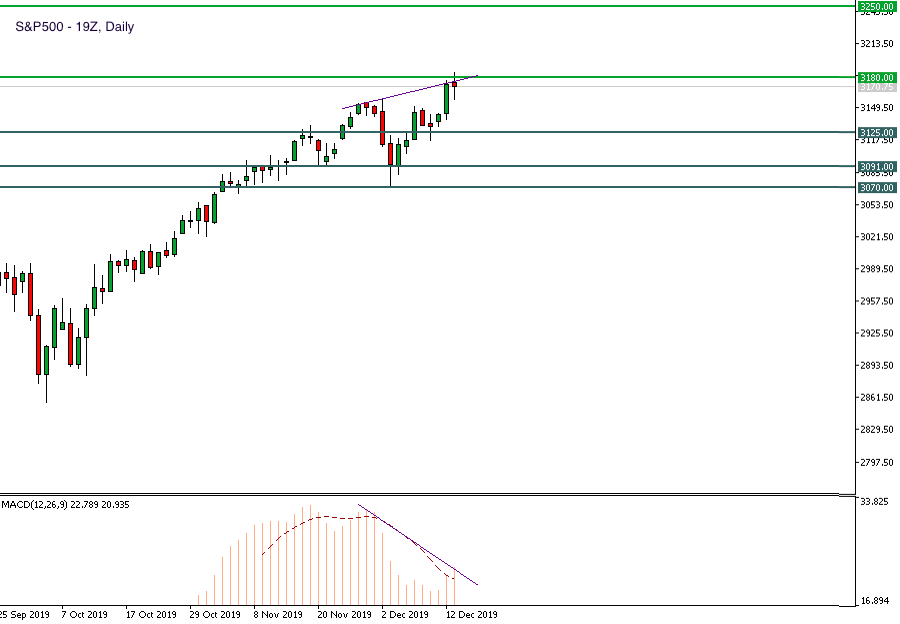
There is a high probability that the index will stay above 3,000 in any case until the beginning of 2020.
The year is near its end and it’s time to get some projection for 2020.
Wall Street’s analysts predict a modest rise of the index in 2020 compared to 2019. The risk reasons are a slowdown in America’s economic growth, reduction in stock buybacks, and high volatility due to the presidential elections, prolonged trade risks are likely to affect the willingness of the investors to buy stocks.
Bank of America considers an additional thread. The key components of indexes are mostly bought by passive funds, not active investors. It leads to the fact that fundamental stock indices are relegated to the background in the flow of funds. Around half of US stock ownership is passive. Such stocks have wider bid-ask spreads than usual that cancels potential transactions and suppresses liquidity of shares.
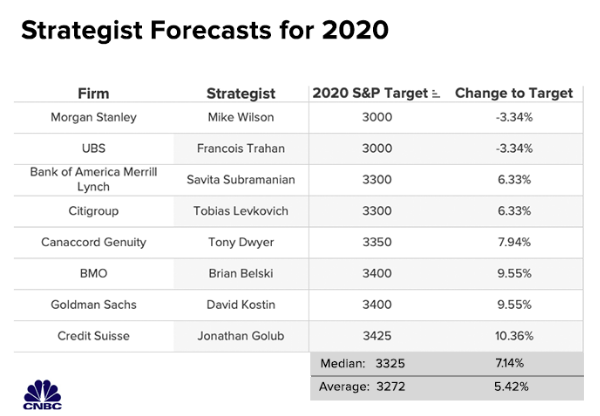
Source of the table: CNBC
The average forecast for the S&P 500 in 2020 is $3,272 by the end of the year (that is a 5% rise from the current levels).
Credit Suisse predicts the S&P 500 price at $3,425 that is about 9% upside from current levels. As for favored sectors, they are technology, discretionary, financials, industrials, and materials. The defensive sectors are supposed to lag.
Merrill Lynch places the target at $3,300. It sees the US domestic earnings to increase faster than multinationals, with slowing estimate cuts for value stocks and guidance being better for small-cap stocks.
JPMorgan declared that there could be as much as 25% earnings growth in the case of the US-China trade truce, but if only the deal cancels all the existing tariffs that have been implemented. It sounds not that realistic.
RBC Capital Markets sees the S&P 500 at $3,350 although there may be a near-term market top from excessive sentiment and near-term consolidation.
Source of the chart: Investing.com
On the chart above, you can see the highest, the lowest, and the average price projections for 2020.
We can say that this year the S&P 500 was a great gainer. However, the surge may be limited next year. The major factors of the risk-off sentiment that may pull the index down are the American economic data, trade disputes, slowdown in the global growth and possible recession. The index is expected to stay above the $3,000 level. Nevertheless, the rise will not be that extensive as it was in 2019. Investors should pay high attention to the market environment checking the news. Analysts may change the forecasts during the year, that is why it’s important to be up to date.
The G20 summit took place in Bali, Indonesia, on November 2022…

The deafening news shocked the whole world yesterday: the British Queen Elizabeth II died peacefully at the age of 96…
After months of pressure from the White House, Saudi Arabia relented and agreed with other OPEC+ members to increase production.

eurusd-is-falling-what-to-expect-from-the-future-price-movement

Greetings, fellow forex traders! Exciting news for those with an eye on the Australian market - the upcoming interest rate decision could be good news for Aussies looking to refinance or take out new loans. The Mortgage and Finance Association Australia CEO, Anja Pannek, has...

Hold onto your hats, folks! The Japanese yen took a nosedive after the Bank of Japan (BOJ) left its ultra-loose policy settings unchanged, including its closely watched yield curve control (YCC) policy. But wait, there's more! The BOJ also removed its forward guidance, which had previously pledged to keep interest rates at current or lower levels. So, what's the scoop? Market expectations had been subdued going into the meeting, but some were still hoping for tweaks to the forward guidance to prepare for an eventual exit from the bank's massive stimulus


Your request is accepted.
We will call you at the time interval that you chose
Next callback request for this phone number will be available in 00:30:00
If you have an urgent issue please contact us via
Live chat
Internal error. Please try again later