


Best Trade Ideas for April
I know we've had quite an amazing run these past few month, with over 78% accuracy in our trade ideas and sentiments, and thousands of pips in profits monthly...

Don’t waste your time – keep track of how NFP affects the US dollar!
Data Collection Notice
We maintain a record of your data to run this website. By clicking the button, you agree to our Privacy Policy.

Beginner Forex Book
Your ultimate guide through the world of trading.

Check Your Inbox!
In our email, you will find the Forex 101 book. Just tap the button to get it!
Risk warning: ᏟᖴᎠs are complex instruments and come with a high risk of losing money rapidly due to leverage.
66.43% of retail investor accounts lose money when trading ᏟᖴᎠs with this provider.
You should consider whether you understand how ᏟᖴᎠs work and whether you can afford to take the high risk of losing your money.
Warning! Old version of the browser!
Press one of the icons below to proceed to the official website of the developer and download the latest version of your browser.

Online Forex broker
Information is not investment advice
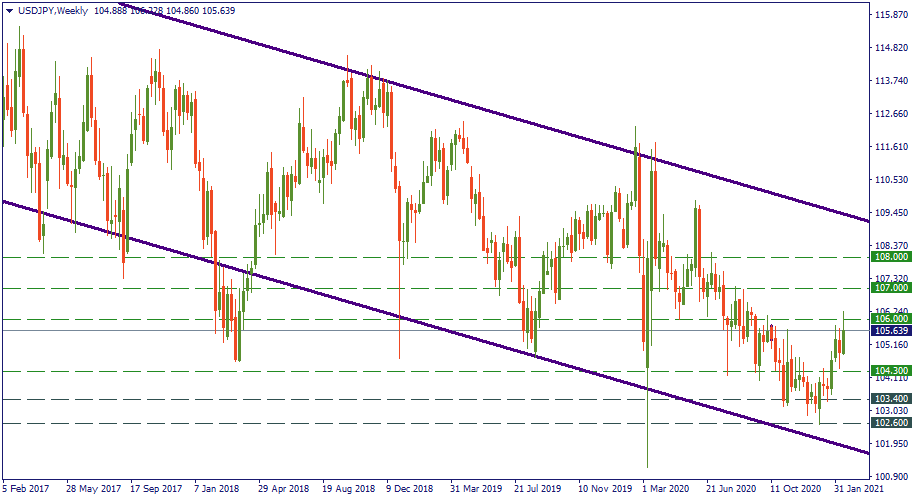
If you open the weekly chart of USD/JPY, you’ll see that most of the performance since 2015 has been following the marked trend. So far, there is little evidence – neither fundamental nor technical – to assume that this downtrend is going to change. Especially that many observers comment that the USD may grow stronger that it used to be until recently. Therefore, let’s presume that the currency pair just has touched the bottom of the downtrend at 102.60 and will now bounce upwards to form an upswing. How would this scenario look like?
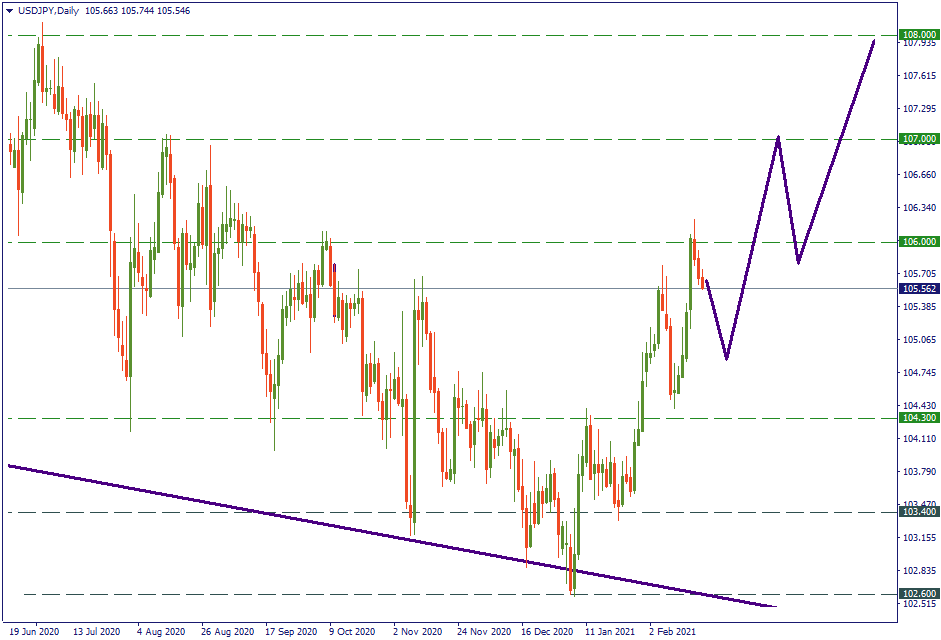
On the daily chart, you’ll notice that the upward movement of USD/JPY roughly repeats the steps it did on the way down. For example, 104.30 used to be the resistance zone in November – and so it was in January until the pair finally broke it. After that, USD/JPY stopped at 105.65 – exactly the high of November 12. Finally, the current resistance of 106.00 corresponds to the October highs. That’s why it seems logical to assume the USD/JPY may be making similar swings around the resistance levels it left before. Therefore, the next one we’d have to look for is 107.00, with the possible intermediary targets at 106.20 and 106.60. 107.00 is the August resistance, and 108.00 was the June-July high. Therefore, when and if 107.00 gets broken, 108.00 will be the one to go. If our hypothesis of the repetition of the previous highs is correct, this cascade-like series of upswing will take around a month to climb to 108.00. That’s why, if you are to test this approach, it will be more fitting for mid-term position trading, with one single upswing taking several to complete. Let’s time-test it!
I know we've had quite an amazing run these past few month, with over 78% accuracy in our trade ideas and sentiments, and thousands of pips in profits monthly...

Futures for Canada's main stock index rose on Monday, following positive global markets and gains in crude oil prices. First Citizens BancShares Inc's announcement of purchasing the loans and deposits of failed Silicon Valley Bank also boosted investor confidence in the global financial system...
Investor confidence in the global financial system has been shaken by the collapse of Silicon Valley Bank and Credit Suisse. As a result, many are turning to bearer assets, such as gold and bitcoin, to store value outside of the system without...

eurusd-is-falling-what-to-expect-from-the-future-price-movement

Greetings, fellow forex traders! Exciting news for those with an eye on the Australian market - the upcoming interest rate decision could be good news for Aussies looking to refinance or take out new loans. The Mortgage and Finance Association Australia CEO, Anja Pannek, has...

Hold onto your hats, folks! The Japanese yen took a nosedive after the Bank of Japan (BOJ) left its ultra-loose policy settings unchanged, including its closely watched yield curve control (YCC) policy. But wait, there's more! The BOJ also removed its forward guidance, which had previously pledged to keep interest rates at current or lower levels. So, what's the scoop? Market expectations had been subdued going into the meeting, but some were still hoping for tweaks to the forward guidance to prepare for an eventual exit from the bank's massive stimulus


Your request is accepted.
We will call you at the time interval that you chose
Next callback request for this phone number will be available in 00:30:00
If you have an urgent issue please contact us via
Live chat
Internal error. Please try again later