

Williams’ Strategy
Bill Williams is the creator of some of the most popular market indicators: Awesome Oscillator, Fractals, Alligator, and Gator.
For a seamless experience, click “Redirect me.”

Don’t waste your time – keep track of how NFP affects the US dollar!
Data Collection Notice
We maintain a record of your data to run this website. By clicking the button, you agree to our Privacy Policy.

Beginner Forex Book
Your ultimate guide through the world of trading.

Check Your Inbox!
In our email, you will find the Forex 101 book. Just tap the button to get it!
Risk warning: ᏟᖴᎠs are complex instruments and come with a high risk of losing money rapidly due to leverage.
71.99% of retail investor accounts lose money when trading ᏟᖴᎠs with this provider.
You should consider whether you understand how ᏟᖴᎠs work and whether you can afford to take the high risk of losing your money.
Warning! Old version of the browser!
Press one of the icons below to proceed to the official website of the developer and download the latest version of your browser.

Online Forex broker
Information is not investment advice
In the previous article, we explained how to trade using Moving Average. Now it’s time to look into another useful indicator called Bollinger Bands. The indicator is available not only in MetaTrader but also in FBS Trader App.
It’s a technical indicator that got its name after its maker – famous trader John Bollinger. Bollinger combined three Moving Averages in a single indicator. The middle line is a Simple Moving Average and so are the outer bands with the exception that they are shifted upper and lower to create a sort of channel.
The biggest advantage of this indicator is that it offers traders a great tool for visual analysis. It’s assumed that the price spends about 95% of the time inside the Bollinger Bands channel. As this channel is made of Moving Averages, it widens and narrows together with the swings of the price reflecting volatility. As the price spends just 5% outside the Bands, traders track the situations when it leaves the Bollinger channel. Most often, the price spends no more than four candlesticks above the upper Bollinger Band or below the lower Bollinger Band and then a correction takes place. Knowing this allows trading on the price’s reversal and return to the middle line. This approach works best when the market is in a range or a slow trend.
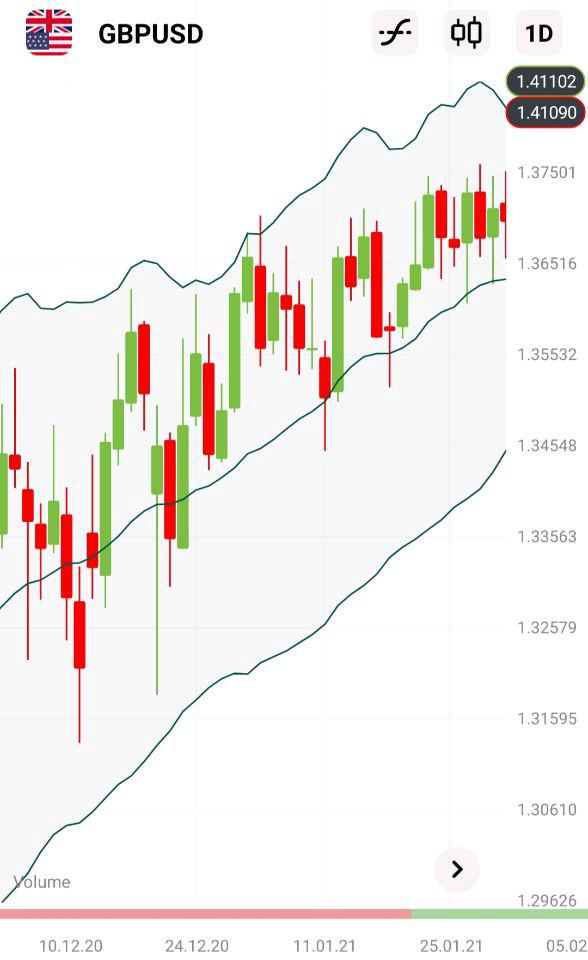
The middle line can also act as dynamic support/resistance. In a strong uptrend, the price moves mostly between the upper band and the middle band.
By default, the settings are ‘20’ for the period and ‘2’ for the deviation. This is a classic set of parameters used by most traders. However, you may try other periods and deviations. The general recommendation is that the number for periods should be between 13 and 24, while the deviation should be in the range between 2 and 5.
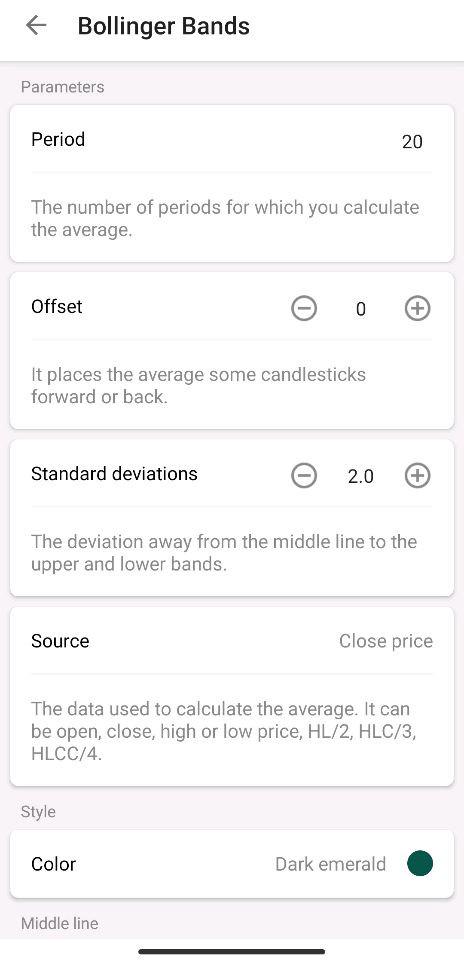
Period. The smaller the period, the more times the price will touch and leave the outer Bands. On the one hand, this means that there will be more signals. On the other hand, more signals will be false. At the same time, when the period is too big, the indicator becomes less sensitive. As a result, as with many other things in life, it’s necessary to find a balance.
Deviation. Higher deviation moves the outer bands further apart. If the Bands are so wide that the price never touches them, the indicator loses much of its usefulness. So start with ‘2’ and see if it’s necessary to make any changes or not.
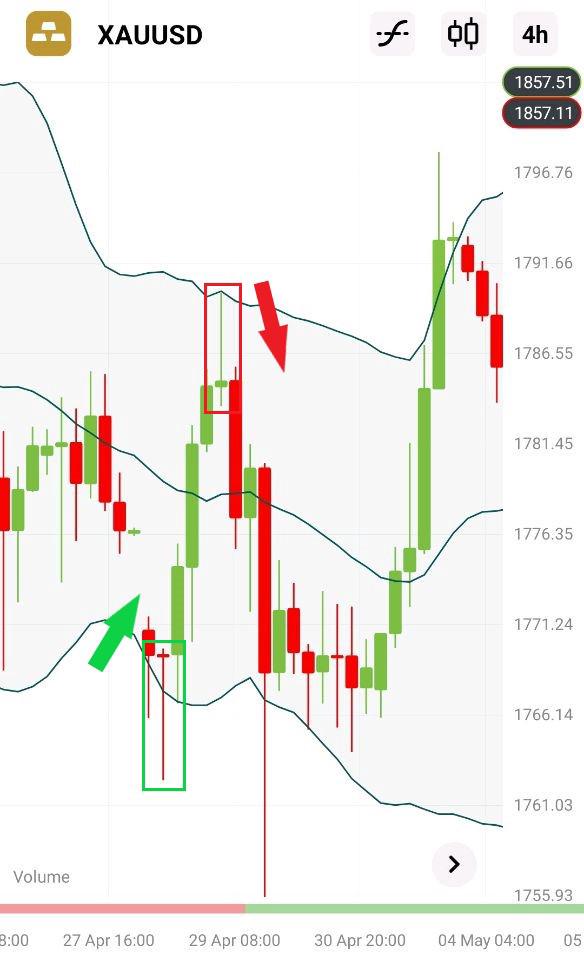
This strategy relies on the fact that after deviating too much from the average level, the price tends to return to it.
For a BUY order
If a pin bar candlestick with a long lower shadow appears at the lower Bollinger band, open a Buy order above this candlestick. Put Take Profit at the middle/upper Bollinger Band and a Stop Loss below the pin bar’s minimum.
For a SELL order
If a pin bar candlestick with a long upper shadow appears at the upper Bollinger Band, open a Sell order below this candlestick. Put Take Profit at the middle/lower Bollinger Band and a Stop Loss above the pin bar’s maximum
You can use a 100-period Moving Average as a filter: consider only BUY trades when the price is above this line and only SELL trades when the price is below this line.
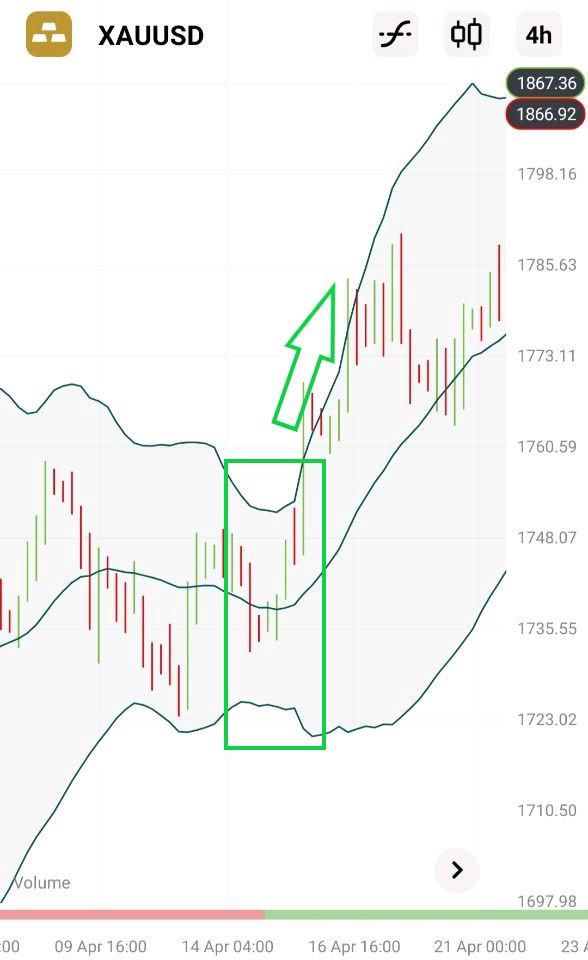
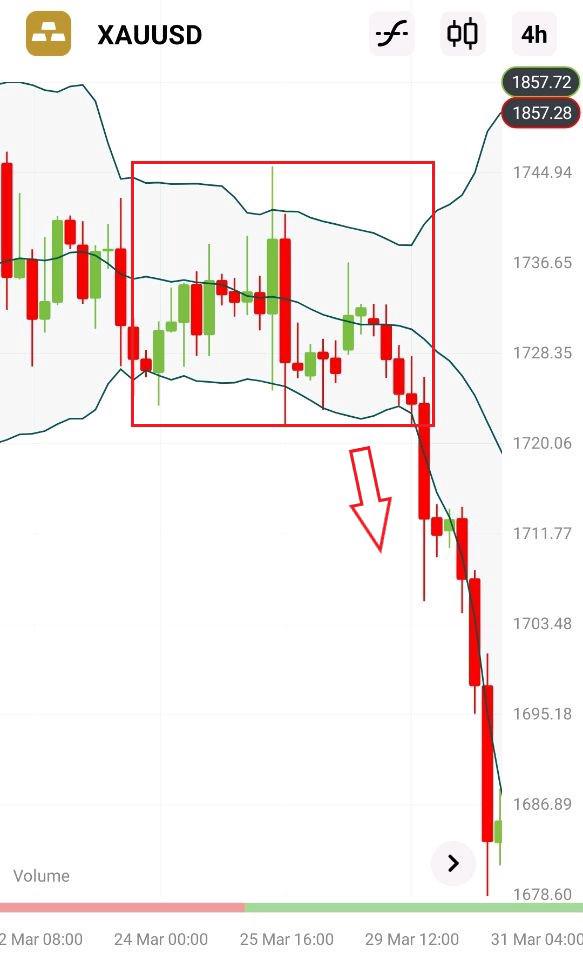
The strategy is built on the idea that after the market calms down, there will be a spike in volatility and a breakout.

Bill Williams is the creator of some of the most popular market indicators: Awesome Oscillator, Fractals, Alligator, and Gator.

Trend strategies are good - they may give significantly good results in any time frame and with any assets. The main idea of the ADX Trend-Based strategy is to try to catch the beginning of the trend.

Counter-trend strategies are always the most dangerous but also the most profitable. We are pleased to present an excellent counter-trend strategy for working in any market and with any assets.

eurusd-is-falling-what-to-expect-from-the-future-price-movement

Greetings, fellow forex traders! Exciting news for those with an eye on the Australian market - the upcoming interest rate decision could be good news for Aussies looking to refinance or take out new loans. The Mortgage and Finance Association Australia CEO, Anja Pannek, has...

Hold onto your hats, folks! The Japanese yen took a nosedive after the Bank of Japan (BOJ) left its ultra-loose policy settings unchanged, including its closely watched yield curve control (YCC) policy. But wait, there's more! The BOJ also removed its forward guidance, which had previously pledged to keep interest rates at current or lower levels. So, what's the scoop? Market expectations had been subdued going into the meeting, but some were still hoping for tweaks to the forward guidance to prepare for an eventual exit from the bank's massive stimulus


Your request is accepted.
We will call you at the time interval that you chose
Next callback request for this phone number will be available in 00:30:00
If you have an urgent issue please contact us via
Live chat
Internal error. Please try again later