


Best Trade Ideas for April
I know we've had quite an amazing run these past few month, with over 78% accuracy in our trade ideas and sentiments, and thousands of pips in profits monthly...

Don’t waste your time – keep track of how NFP affects the US dollar!
Data Collection Notice
We maintain a record of your data to run this website. By clicking the button, you agree to our Privacy Policy.

Beginner Forex Book
Your ultimate guide through the world of trading.

Check Your Inbox!
In our email, you will find the Forex 101 book. Just tap the button to get it!
Risk warning: ᏟᖴᎠs are complex instruments and come with a high risk of losing money rapidly due to leverage.
66.43% of retail investor accounts lose money when trading ᏟᖴᎠs with this provider.
You should consider whether you understand how ᏟᖴᎠs work and whether you can afford to take the high risk of losing your money.
Warning! Old version of the browser!
Press one of the icons below to proceed to the official website of the developer and download the latest version of your browser.

Online Forex broker
Information is not investment advice
In this article, we will discuss oil, EUR/USD movements during the past week and try to find short- and long-term trading opportunities.
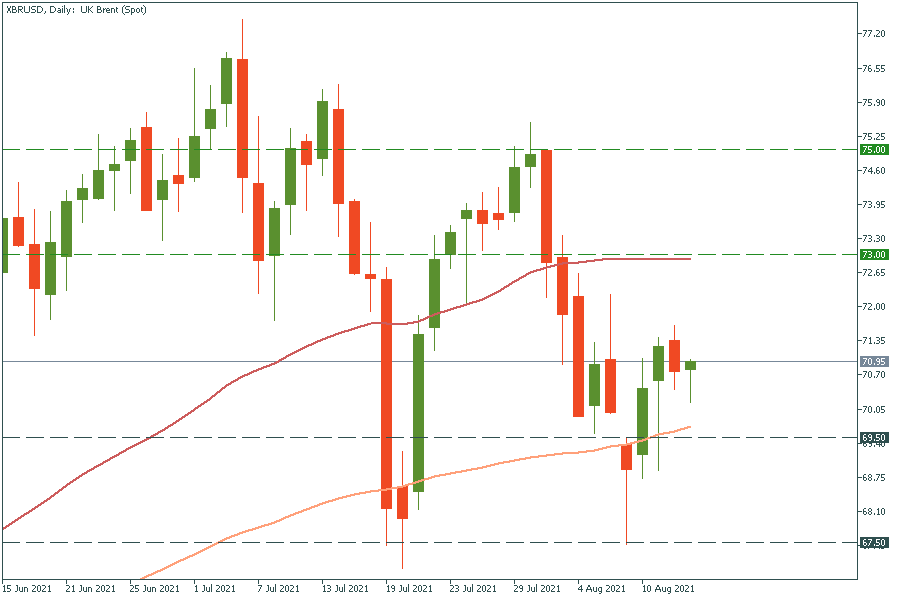
Oil demonstrated a positive dynamic during the past week after the massive drop. Data from the US Energy Information Administration on Wednesday showed that fuel demand of the top global crude user has averaged 20.6 million barrels per day (BPD) over the past four weeks, roughly in line with 2019 levels. OPEC agreed to boost oil supply by 400,000 BPD monthly, starting in August. However, there are still concerns that the increase will not be enough to meet demand as the US and Europe ease their coronavirus-induced movement restrictions.
In this case, $73 and $75 levels are the main targets for the upcoming week. You can find more relative technical analysis in the previous article related to oil.
Daily XBR/USD chart
EUR/USD
The currency pair came to the highly important support level at 1.171 after the US employment announcement.
The price has formed a “head and shoulders” pattern and 1-2-3 pattern, both point us to the upcoming decline with the target at 1.12. In short term, we expect to see a pullback up to 1.18 according to RSI and MACD oscillators. In this case, the price will retest the neckline and confirm the pattern. Let’s check both patterns!
Daily chart, “Head and shoulders”
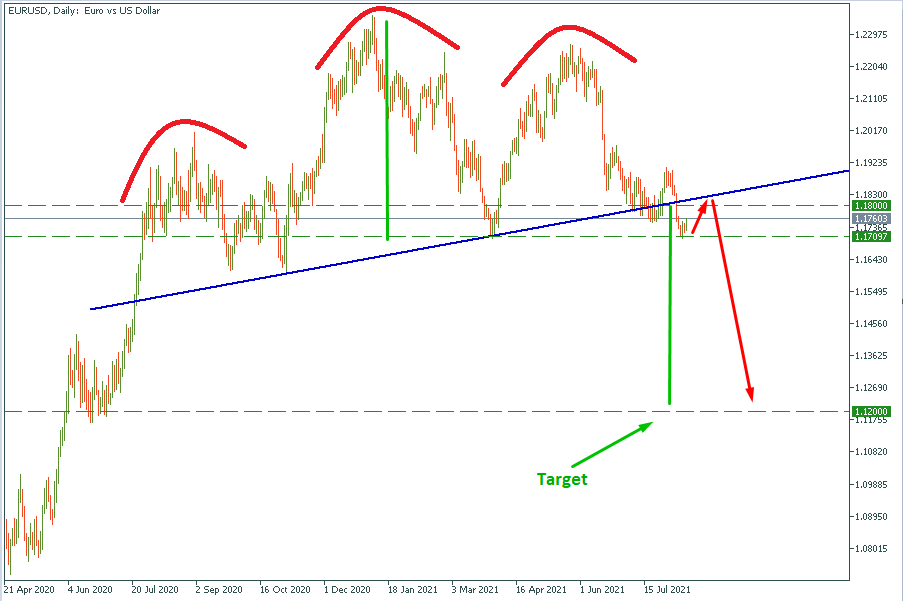
If the price retests neckline from the bottom and bounces off it, the “head with shoulders” patter will be confirmed.
Daily chart, “1-2-3 pattern”
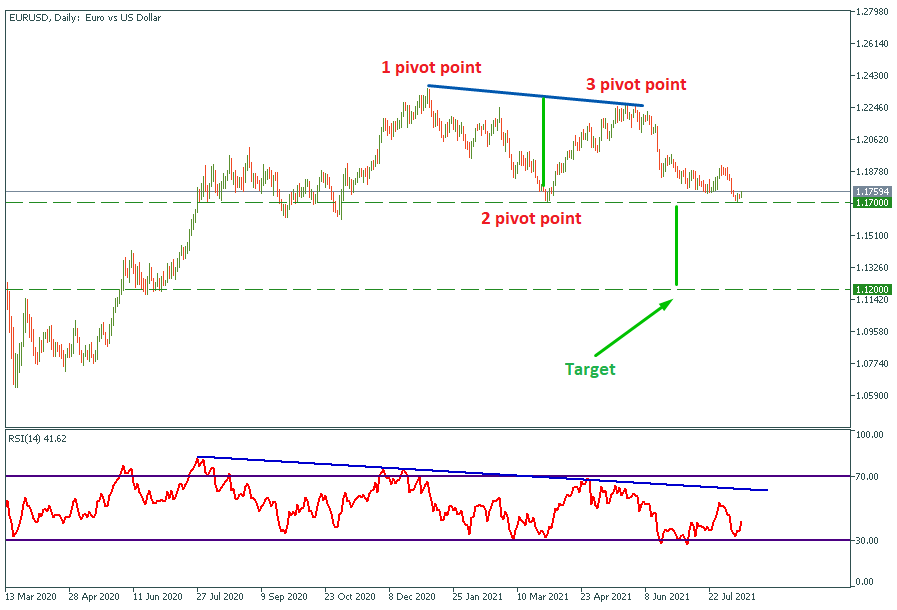
With the RSI divergence, the chart has formed a 1-2-3 pattern. The target measures as the vertical line connecting the 2-pivot point level and the middle point on the line between 1 and 3 pivot points. As soon as the price breaks through the 1.17 support level the pattern will be confirmed.

I know we've had quite an amazing run these past few month, with over 78% accuracy in our trade ideas and sentiments, and thousands of pips in profits monthly...

Futures for Canada's main stock index rose on Monday, following positive global markets and gains in crude oil prices. First Citizens BancShares Inc's announcement of purchasing the loans and deposits of failed Silicon Valley Bank also boosted investor confidence in the global financial system...

Investor confidence in the global financial system has been shaken by the collapse of Silicon Valley Bank and Credit Suisse. As a result, many are turning to bearer assets, such as gold and bitcoin, to store value outside of the system without...

eurusd-is-falling-what-to-expect-from-the-future-price-movement

Greetings, fellow forex traders! Exciting news for those with an eye on the Australian market - the upcoming interest rate decision could be good news for Aussies looking to refinance or take out new loans. The Mortgage and Finance Association Australia CEO, Anja Pannek, has...

Hold onto your hats, folks! The Japanese yen took a nosedive after the Bank of Japan (BOJ) left its ultra-loose policy settings unchanged, including its closely watched yield curve control (YCC) policy. But wait, there's more! The BOJ also removed its forward guidance, which had previously pledged to keep interest rates at current or lower levels. So, what's the scoop? Market expectations had been subdued going into the meeting, but some were still hoping for tweaks to the forward guidance to prepare for an eventual exit from the bank's massive stimulus


Your request is accepted.
We will call you at the time interval that you chose
Next callback request for this phone number will be available in 00:30:00
If you have an urgent issue please contact us via
Live chat
Internal error. Please try again later