


Best Trade Ideas for April
I know we've had quite an amazing run these past few month, with over 78% accuracy in our trade ideas and sentiments, and thousands of pips in profits monthly...

Don’t waste your time – keep track of how NFP affects the US dollar!
Data Collection Notice
We maintain a record of your data to run this website. By clicking the button, you agree to our Privacy Policy.

Beginner Forex Book
Your ultimate guide through the world of trading.

Check Your Inbox!
In our email, you will find the Forex 101 book. Just tap the button to get it!
Risk warning: CFDs are complex instruments and come with a high risk of losing money rapidly due to leverage.
66.43% of retail investor accounts lose money when trading CFDs with this provider.
You should consider whether you understand how CFDs work and whether you can afford to take the high risk of losing your money.
Warning! Old version of the browser!
Press one of the icons below to proceed to the official website of the developer and download the latest version of your browser.

Online Forex broker
Information is not investment advice
4H chart
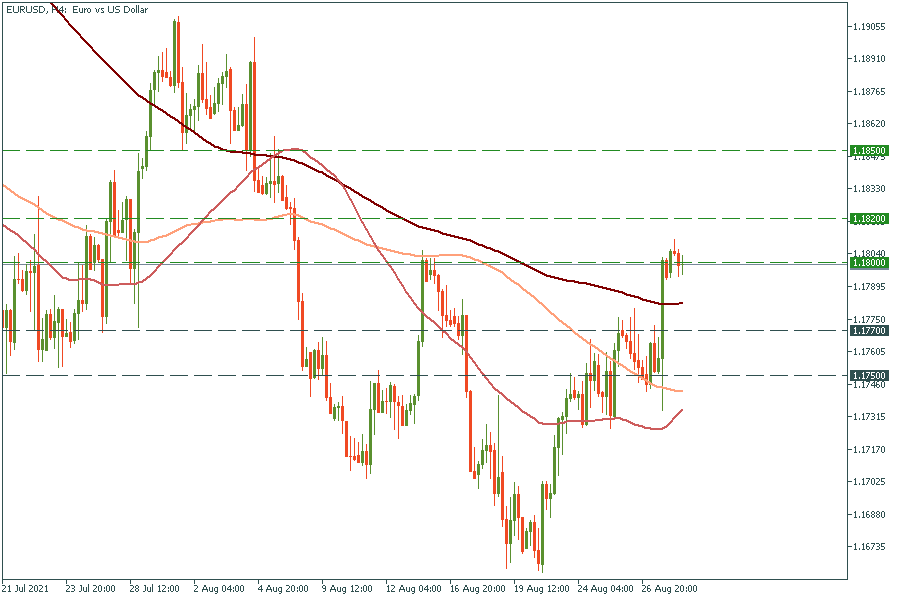
EUR/USD surged after Powell’s speech on Friday. At the moment, it is trading around the key resistance of 1.18. Led by European countries' CPI and GDP reports during this week the EUR might get stronger and push the pair higher. If it breaks through the way to 1.182 and 1.185 will be open. Otherwise, we might see a pullback down to 1.177 and 1.175.
4H chart
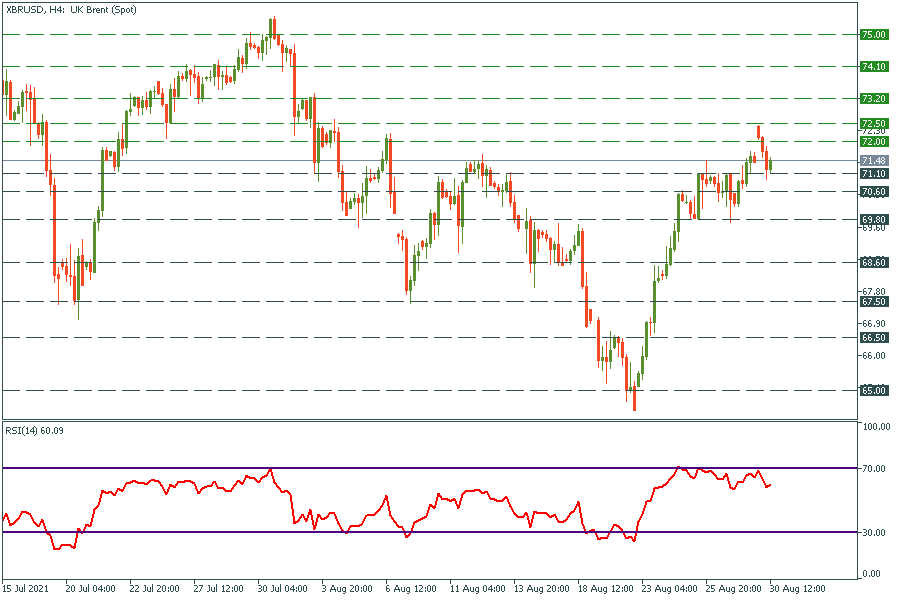
Oil demonstrated the best week since the beginning of the Covid-19 pandemic. It also opened with a big gap on the Monday trading session but managed to close it shortly. It played out all the bearish divergences and at the moment there are no signs of the upcoming pullback. The upcoming OPEC+ decision about supply reduction might push it even higher. $72.5, $73.2, $74.1, and $75 are the main targets.
Alibaba is still under pressure from the Chinese government, but concerns get easier as time pass. During last week Alibaba has been trading sideways and by the end of the week closed at the same price level as opened at the beginning. This week might define the middle-term trend for Alibaba stock price.
4H chart
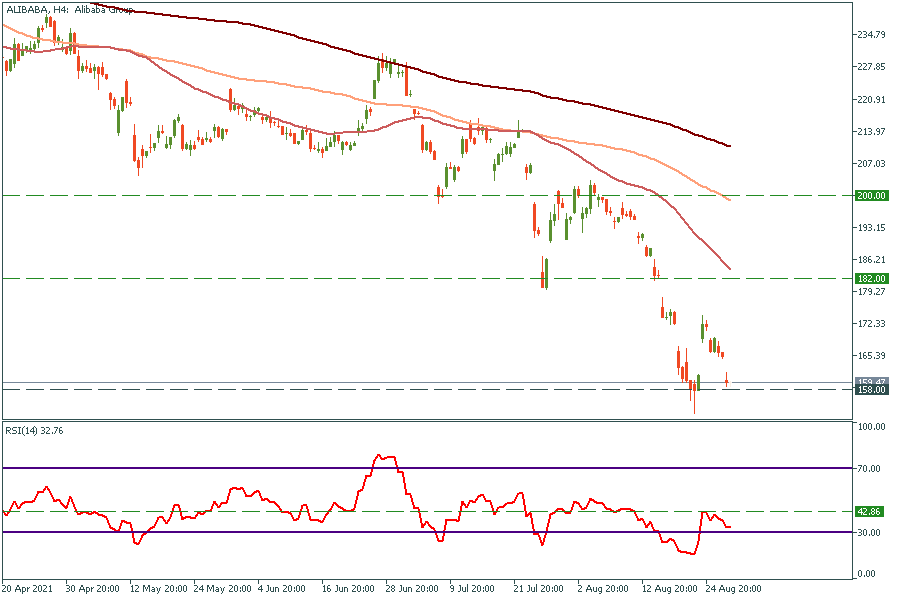
The RSI “swing rejection” pattern may occur on the 4H chart. As soon as 4H RSI closes above 42.86 (on condition it doesn’t drop below 30) this pattern will be proved. In this case, the targets will be $182 and $200.
Daily chart
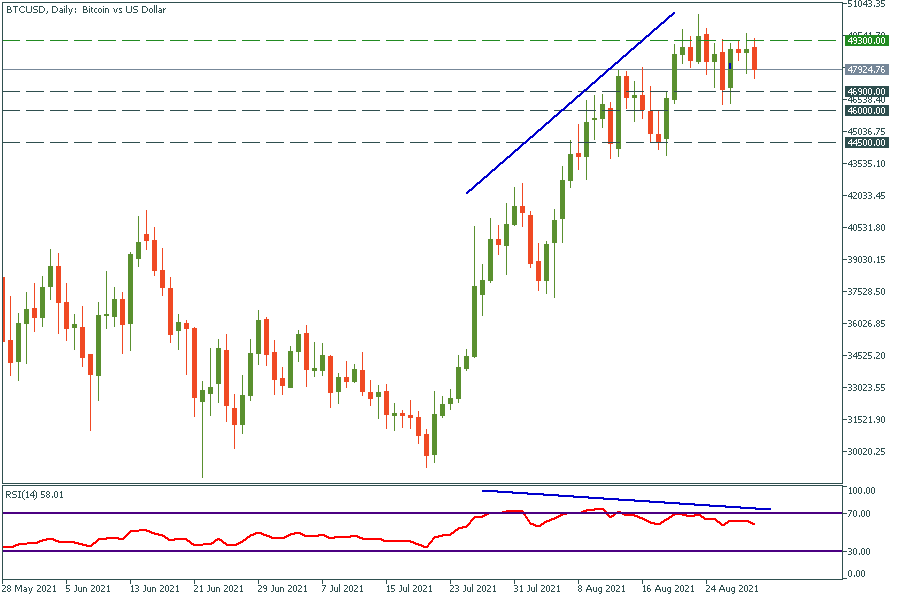
The bearish divergence occurred on Bitcoin daily chart.
4H chart
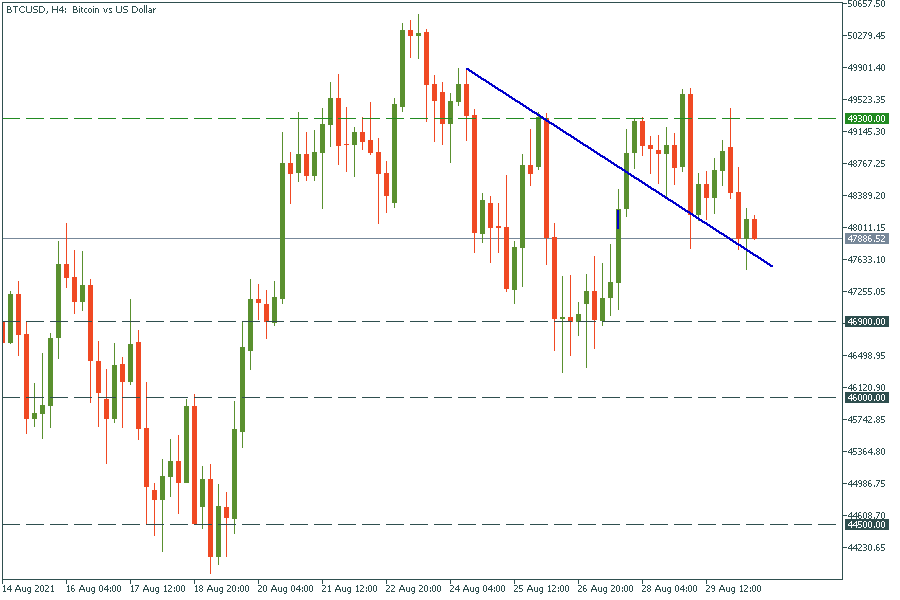
The asset has formed the support line. If the price closes below this support, it will be a bearish sign for Bitcoin. In this case, it will drop to $46 900, $46 000, and $44 500, which are the main support levels for now.
$49 300 - $49 500 is a massive resistance range at the moment. If the price comes there, it will be a good opportunity to open a short trade.
I know we've had quite an amazing run these past few month, with over 78% accuracy in our trade ideas and sentiments, and thousands of pips in profits monthly...

Futures for Canada's main stock index rose on Monday, following positive global markets and gains in crude oil prices. First Citizens BancShares Inc's announcement of purchasing the loans and deposits of failed Silicon Valley Bank also boosted investor confidence in the global financial system...

Investor confidence in the global financial system has been shaken by the collapse of Silicon Valley Bank and Credit Suisse. As a result, many are turning to bearer assets, such as gold and bitcoin, to store value outside of the system without...

eurusd-is-falling-what-to-expect-from-the-future-price-movement

Greetings, fellow forex traders! Exciting news for those with an eye on the Australian market - the upcoming interest rate decision could be good news for Aussies looking to refinance or take out new loans. The Mortgage and Finance Association Australia CEO, Anja Pannek, has...

Hold onto your hats, folks! The Japanese yen took a nosedive after the Bank of Japan (BOJ) left its ultra-loose policy settings unchanged, including its closely watched yield curve control (YCC) policy. But wait, there's more! The BOJ also removed its forward guidance, which had previously pledged to keep interest rates at current or lower levels. So, what's the scoop? Market expectations had been subdued going into the meeting, but some were still hoping for tweaks to the forward guidance to prepare for an eventual exit from the bank's massive stimulus


Your request is accepted.
We will call you at the time interval that you chose
Next callback request for this phone number will be available in 00:30:00
If you have an urgent issue please contact us via
Live chat
Internal error. Please try again later