

Best Trade Ideas for April
I know we've had quite an amazing run these past few month, with over 78% accuracy in our trade ideas and sentiments, and thousands of pips in profits monthly...

Don’t waste your time – keep track of how NFP affects the US dollar!
Data Collection Notice
We maintain a record of your data to run this website. By clicking the button, you agree to our Privacy Policy.

Beginner Forex Book
Your ultimate guide through the world of trading.

Check Your Inbox!
In our email, you will find the Forex 101 book. Just tap the button to get it!
Risk warning: ᏟᖴᎠs are complex instruments and come with a high risk of losing money rapidly due to leverage.
70.72% of retail investor accounts lose money when trading ᏟᖴᎠs with this provider.
You should consider whether you understand how ᏟᖴᎠs work and whether you can afford to take the high risk of losing your money.
Warning! Old version of the browser!
Press one of the icons below to proceed to the official website of the developer and download the latest version of your browser.

Online Forex broker
Information is not investment advice
On May 27, there was a notable drop in the stock market at the beginning of the American session. Later on, most stocks picked up making a quick reversal. That gives us a good opportunity to check for the reversal chart patterns and compare them between different stocks. We will take three from different market sectors to avoid industry-like pattern repetition: Amazon, Netflix, and Amazon. See below.
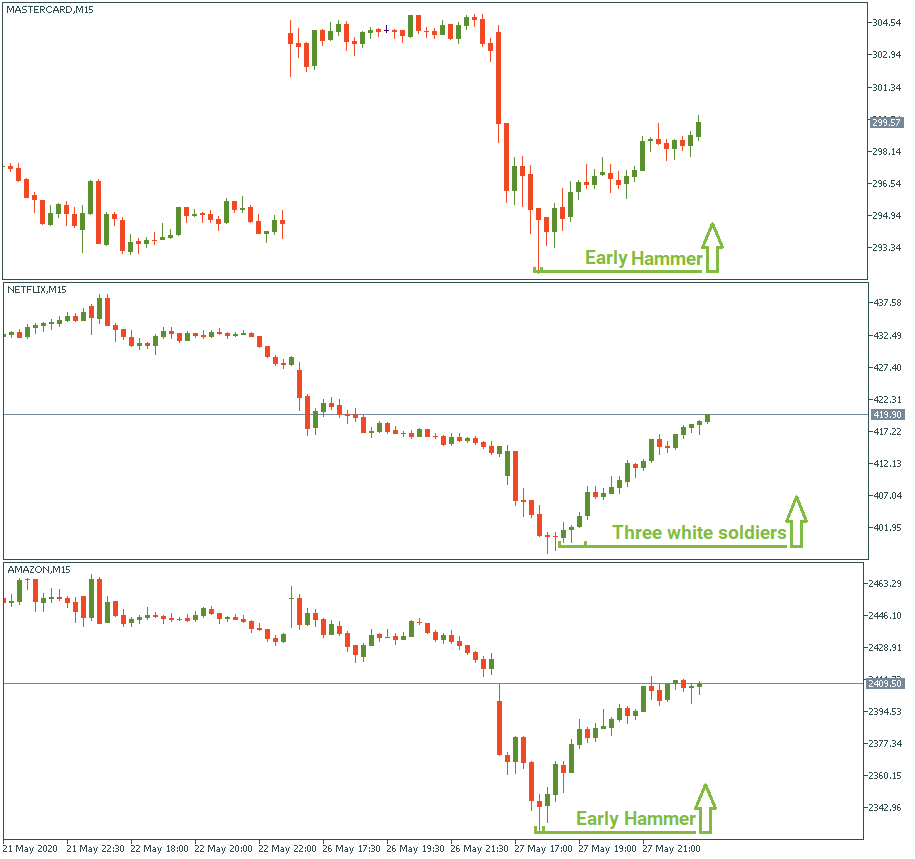
At the bottom of each drop, we have early signs of a bullish reversal. Amazon and Mastercard have a hammer chart formation at the bottom of the downswing. Although both hammers are of the same color as the red of the bearish candles, it may be taken as an early precursor of a possible change of market mood. Netflix, in turn, had several bullish candles in a row which laid the start of the upswing we see.
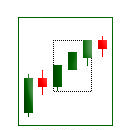
Hammer is useful because it is a 1-candle pattern. It does require confirmation and time-verification just as all other patterns but it is easy to pick it out from the chart because it has a very distinctive form. Works both in bullish and bearish reversals.
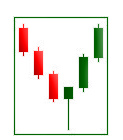
It doesn’t have to be exactly three – in the example of Netflix on May 27 we see series of four bullish candles in a row. The idea is that if after a large bearish move suddenly several bullish candles appear one after another, that means a high potential of a bullish reversal.
You can check the other formations in our article specifically dedicated to reversal patterns – use it and make it work for you!
I know we've had quite an amazing run these past few month, with over 78% accuracy in our trade ideas and sentiments, and thousands of pips in profits monthly...

Futures for Canada's main stock index rose on Monday, following positive global markets and gains in crude oil prices. First Citizens BancShares Inc's announcement of purchasing the loans and deposits of failed Silicon Valley Bank also boosted investor confidence in the global financial system...

Investor confidence in the global financial system has been shaken by the collapse of Silicon Valley Bank and Credit Suisse. As a result, many are turning to bearer assets, such as gold and bitcoin, to store value outside of the system without...

eurusd-is-falling-what-to-expect-from-the-future-price-movement

Greetings, fellow forex traders! Exciting news for those with an eye on the Australian market - the upcoming interest rate decision could be good news for Aussies looking to refinance or take out new loans. The Mortgage and Finance Association Australia CEO, Anja Pannek, has...

Hold onto your hats, folks! The Japanese yen took a nosedive after the Bank of Japan (BOJ) left its ultra-loose policy settings unchanged, including its closely watched yield curve control (YCC) policy. But wait, there's more! The BOJ also removed its forward guidance, which had previously pledged to keep interest rates at current or lower levels. So, what's the scoop? Market expectations had been subdued going into the meeting, but some were still hoping for tweaks to the forward guidance to prepare for an eventual exit from the bank's massive stimulus


Your request is accepted.
We will call you at the time interval that you chose
Next callback request for this phone number will be available in 00:30:00
If you have an urgent issue please contact us via
Live chat
Internal error. Please try again later