


G20: what did the leaders decide?
The G20 summit took place in Bali, Indonesia, on November 2022…

Don’t waste your time – keep track of how NFP affects the US dollar!
Data Collection Notice
We maintain a record of your data to run this website. By clicking the button, you agree to our Privacy Policy.

Beginner Forex Book
Your ultimate guide through the world of trading.

Check Your Inbox!
In our email, you will find the Forex 101 book. Just tap the button to get it!
Risk warning: ᏟᖴᎠs are complex instruments and come with a high risk of losing money rapidly due to leverage.
70.72% of retail investor accounts lose money when trading ᏟᖴᎠs with this provider.
You should consider whether you understand how ᏟᖴᎠs work and whether you can afford to take the high risk of losing your money.
Warning! Old version of the browser!
Press one of the icons below to proceed to the official website of the developer and download the latest version of your browser.

Online Forex broker
Information is not investment advice
Institutional investors speak about further growth in the stock market. In the exact market that has doubled since COVID-19 and doesn’t plan to stop. Is it possible? What can we say about the broad market, and do we have a risk of a deep plunge? All of that plus something extra in our new article.
The S&P 500 has more than doubled since its pandemic lows in March 2020, although gains have recently been capped by fears the Fed could begin to taper its massive stimulus program sooner than expected. The index is up about 20% so far this year. On average the market needs more than 1000 trading sessions to gain 100% from the bottom. This time the result was achieved after mere 354 sessions, it is the fastest recovery of the S&P 500 since World War II.
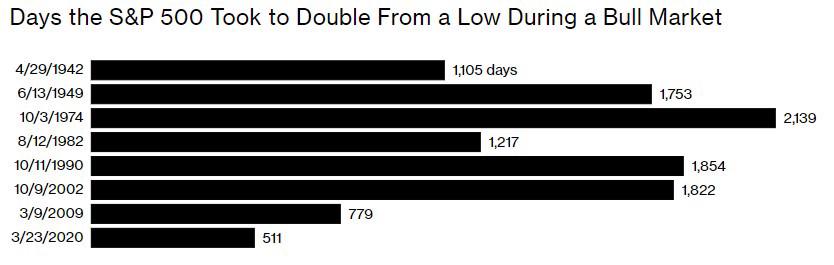
Source: https://www.bloomberg.com/europe
With the second-quarter U.S. reporting season completed, final data shows that about 87% of S&P 500 companies have beaten analysts’ profit expectations, the highest on record. There are several possible reasons for such results:
If it is about the first case, all we can do is to be happy about such flexibility. But if it is about expectations, then the growth is mostly fake. Let me explain this. Expectations from the companies were low. Earnings reports exceeded them. Investors start buying stocks and their price rises, thus, the S&P 500 rises as well. The excitement of retail investors and their hopes about everlasting market growth is a dangerous sign. Extreme greed can lead to extra volatility and big losses. Learn more about the Fear & Greed index in our article to notice the time to open short positions.
Over the last 31 years, there have been nine instances where the S&P 500 rallied 10% in the first eight months of the year followed by an average 8.4% climb over the final four months. September usually is more volatile than August. This is the so-called seasonality of the markets, and it’s time-honored!
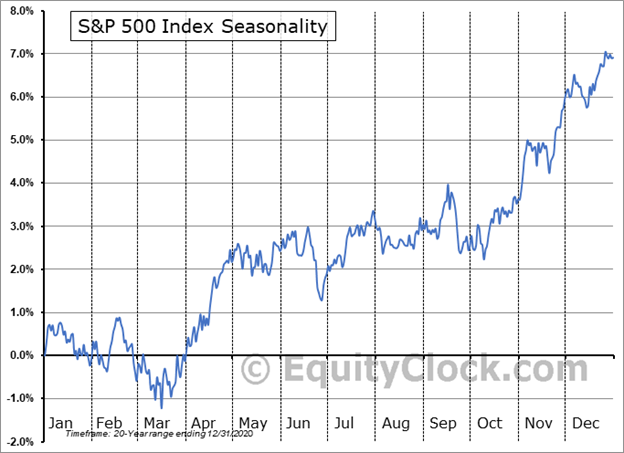
Source: https://charts.equityclock.com/sp-500-index-seasonal-chart
First, let’s have a look at banks’ predictions of the market.
As you can see, only BoA supposes that markets will fall. Notice, that almost every massive correction in history has been accompanied by bankers and institutions’ speeches about further growth. Only six weeks before the Lehman (it was one of the oldest and biggest banks in the US), in early August 2008, both the Federal Reserve and professional forecasters predicted continued growth of the U.S. economy. Contrary to that prediction, the U.S. financial system nearly melted down after the Lehman bankruptcy, and the economy slid into a deep recession. Should we worry now?
As for the current situation, with fears growing that the worst is yet to come, hedge funds stepped up selling. During the first four days of last week (August 15-18), they dumped stocks at the fastest pace in four months, with short sales outpacing long buys by a ratio of 10-to-1. Between you and me – hedge funds know how to trade with minimal risks, they are so-called “clever money”, so if they start selling – it is a reason to reflect on markets, at the very least, and to reduce your long positions as well. Fortunately, with FBS you can open both long and short trades and earn from every movement of the market!
Nevertheless, even the most powerful and clever bears are giving up and closing their shorts. Wells Fargo’s strategists boosted S&P 500 targets, as I mentioned before. As bears give up, their moves add fuel to the rally that’s already the fastest in nine decades but don’t get fascinated with it.
The Jackson Hole Symposium has started today, and we already have a message from FOMC and St. Louis Federal Reserve President James Bullard. The Federal Open Market Committee made hawkish comments, urging the Fed to start tapering its asset purchase program. Federal Reserve Bank of Kansas City President Esther George said that policymakers should begin to slow asset purchases even though the delta variant poses a risk to the US economic outlook and job growth. Fed’s Bullard claimed that the central bank should begin curbing its monthly stimulus efforts soon and have the process wrapped up by the end of March to prevent the US economy from overheating. He added that inflation is growing faster than it was expected and could reach 2.5% by 2022.
We have a divergence on the RSI oscillator. This is a considerable sign of market retracement. Price is still in a trend, but not as strong as before.
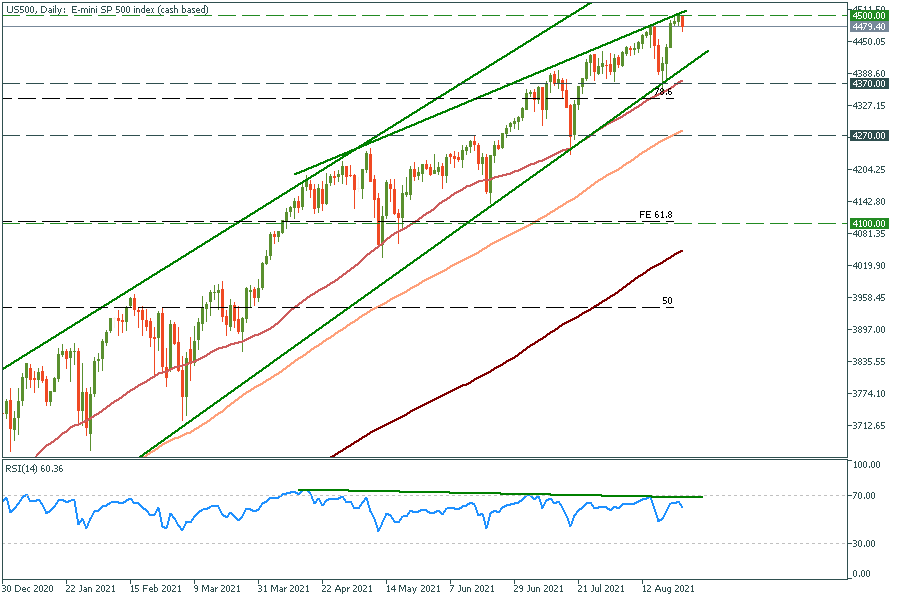
S&P 500 daily chart
Support: 4370, 4270 and 4100
Resistance: 4500 and 4600
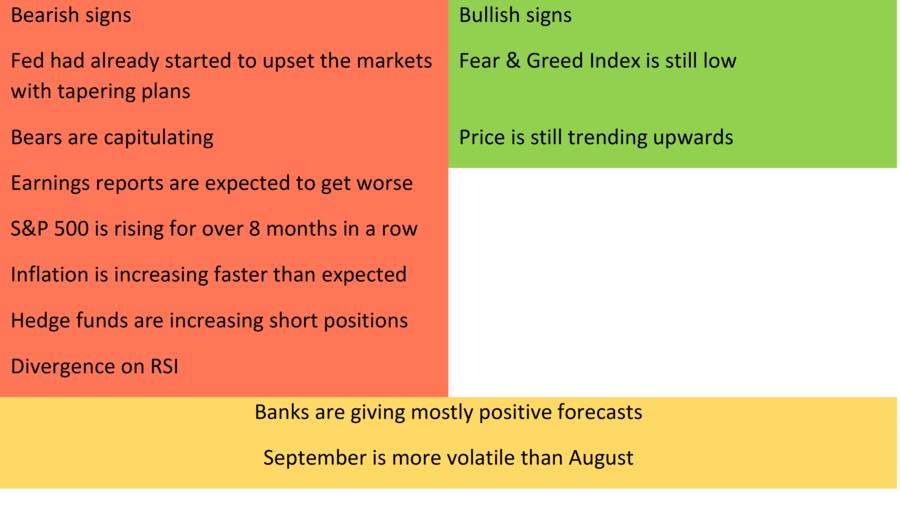
Now we have much more bearish signs. Market crashes are rare but can make a ton of money for a dedicated trader. Be aware though, that US 500 short is a risky countertrend move, always set stop losses and calculate your risks with our trader’s calculator.
The G20 summit took place in Bali, Indonesia, on November 2022…

The deafening news shocked the whole world yesterday: the British Queen Elizabeth II died peacefully at the age of 96…

After months of pressure from the White House, Saudi Arabia relented and agreed with other OPEC+ members to increase production.

eurusd-is-falling-what-to-expect-from-the-future-price-movement

Greetings, fellow forex traders! Exciting news for those with an eye on the Australian market - the upcoming interest rate decision could be good news for Aussies looking to refinance or take out new loans. The Mortgage and Finance Association Australia CEO, Anja Pannek, has...

Hold onto your hats, folks! The Japanese yen took a nosedive after the Bank of Japan (BOJ) left its ultra-loose policy settings unchanged, including its closely watched yield curve control (YCC) policy. But wait, there's more! The BOJ also removed its forward guidance, which had previously pledged to keep interest rates at current or lower levels. So, what's the scoop? Market expectations had been subdued going into the meeting, but some were still hoping for tweaks to the forward guidance to prepare for an eventual exit from the bank's massive stimulus


Your request is accepted.
We will call you at the time interval that you chose
Next callback request for this phone number will be available in 00:30:00
If you have an urgent issue please contact us via
Live chat
Internal error. Please try again later