

Best Trade Ideas for April
I know we've had quite an amazing run these past few month, with over 78% accuracy in our trade ideas and sentiments, and thousands of pips in profits monthly...

Don’t waste your time – keep track of how NFP affects the US dollar!
Data Collection Notice
We maintain a record of your data to run this website. By clicking the button, you agree to our Privacy Policy.

Beginner Forex Book
Your ultimate guide through the world of trading.

Check Your Inbox!
In our email, you will find the Forex 101 book. Just tap the button to get it!
Risk warning: ᏟᖴᎠs are complex instruments and come with a high risk of losing money rapidly due to leverage.
66.43% of retail investor accounts lose money when trading ᏟᖴᎠs with this provider.
You should consider whether you understand how ᏟᖴᎠs work and whether you can afford to take the high risk of losing your money.
Warning! Old version of the browser!
Press one of the icons below to proceed to the official website of the developer and download the latest version of your browser.

Online Forex broker
Information is not investment advice
If you put an oil chart on the S&P500 chart, you will find out that these assets have a strong correlation.
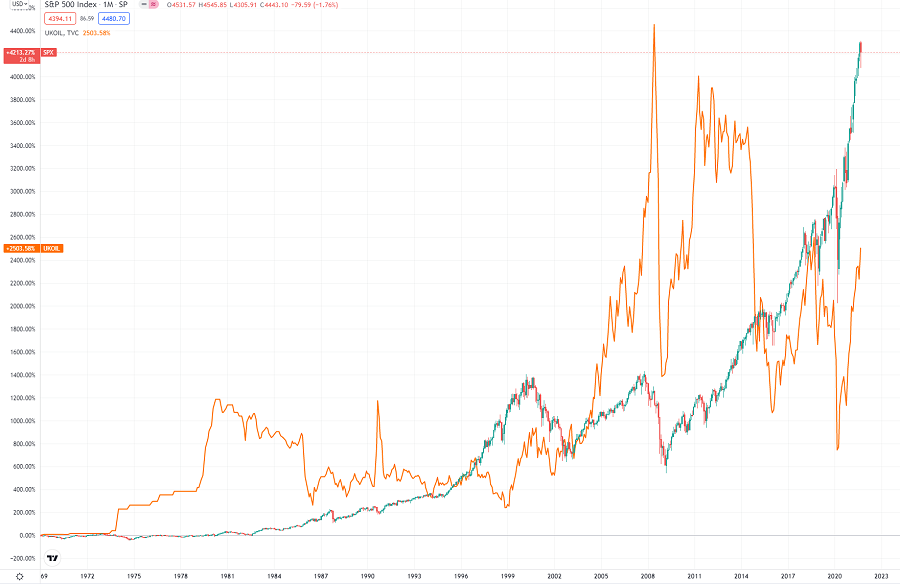
This happens as oil growth is usually caused by an increasing demand, which gets provoked by high economic activity. The current situation does not look similar as an extreme Brent price growth was caused by supply chain problems and nature cataclysms. However, it seems that the global rally is not over, and markets are on the wedge of another growth wave in November.
Brent (XBR/USD) monthly chart
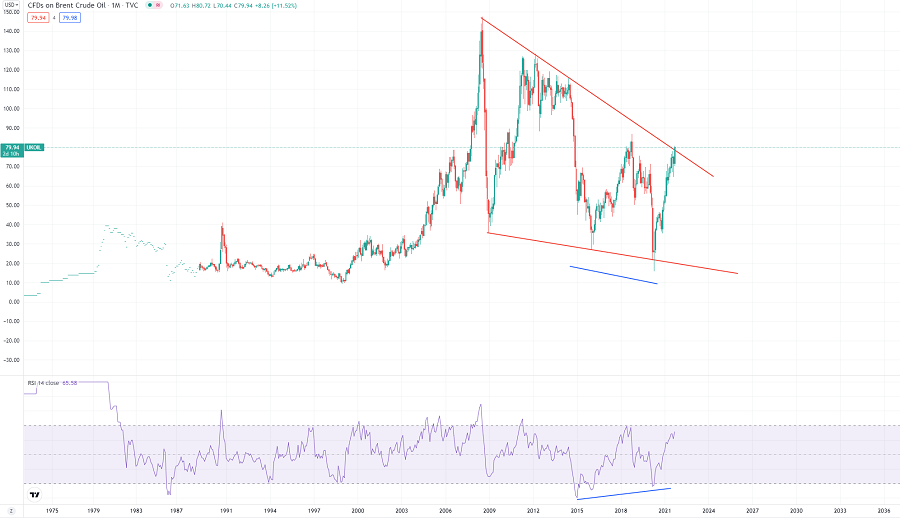
Brent looks extremely bullish on the global chart. And when if not now the pump should finally happen? The macroeconomic situation is conducive to the continuation of the trend, as as the demand for oil will constantly grow during the global economic recovery from the pandemic.
On the monthly chart, Brent is now breaking through the falling wedge. We expect that the trend will continue as September’s candle looks significant. Moreover, you can see that bullish divergence occurred with the RSI chart.
The current correction on the stock market was caused by the risks of a key rate increase. An increase in rates can negatively affect the growth of quotations, but no one has a clue when the rates are going to be finally increased. According to the latest information it might happen in 2022, but no exact dates were announced.
Moreover, the current correction is accompanied by large-scale buybacks from companies, which buy their stocks. And it looks crazy to buy stocks at the very top of their price, right?
Lately in 2021 S&P500 FAANG companies were the main driver of the US main index. According to FBS's Facebook stock analysis, we are ahead of the 5th wave of market growth in 2021. It can happen during the New Year Rally. In the last year, S&P500 gained 11% in November and 4% in December. As we have mentioned before in our historical US market analysis, November and December are the most successful months for the US500 index.
XBR/USD, daily chart
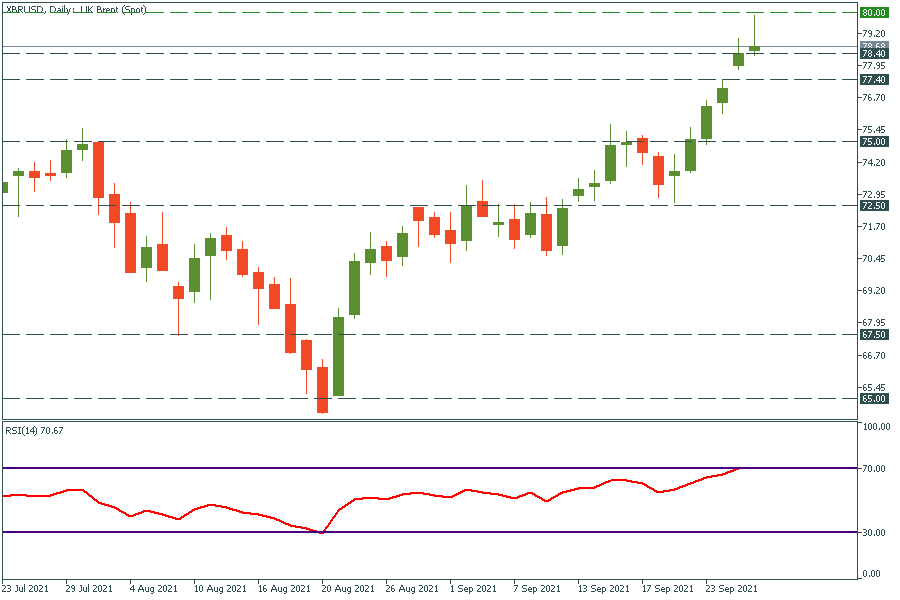
XBR/USD came to the overbought zone according to the RSI. It got down from $80 resistance level lately. The price needs to confirm the previous local high breakout, that’s why I expect a $77.3 level retest. If the price breaks through this level, the next support will be at $75.
After the retest, the rally will continue with the target at $85.
US500, daily chart
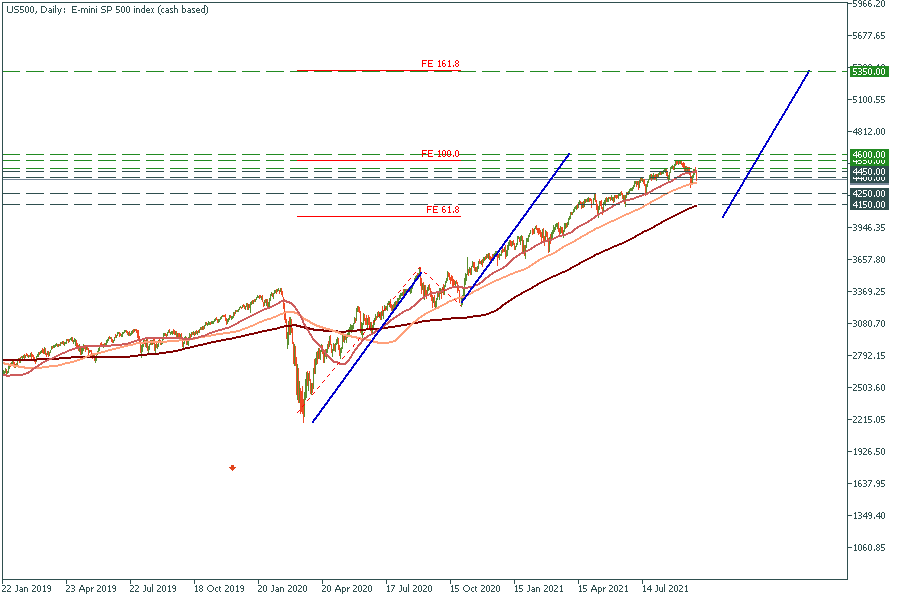
The second wave of this correction began, and according to the wave theory, it should be the same size as the first one. In this case, the target for US500 is 4250.
In long term, the target for US500 is 5300.
You can trade the US500 index with FBS. Also, a great option is to trade FAANG stocks, which usually overperform the main US index.
I know we've had quite an amazing run these past few month, with over 78% accuracy in our trade ideas and sentiments, and thousands of pips in profits monthly...

Futures for Canada's main stock index rose on Monday, following positive global markets and gains in crude oil prices. First Citizens BancShares Inc's announcement of purchasing the loans and deposits of failed Silicon Valley Bank also boosted investor confidence in the global financial system...
Investor confidence in the global financial system has been shaken by the collapse of Silicon Valley Bank and Credit Suisse. As a result, many are turning to bearer assets, such as gold and bitcoin, to store value outside of the system without...

eurusd-is-falling-what-to-expect-from-the-future-price-movement

Greetings, fellow forex traders! Exciting news for those with an eye on the Australian market - the upcoming interest rate decision could be good news for Aussies looking to refinance or take out new loans. The Mortgage and Finance Association Australia CEO, Anja Pannek, has...

Hold onto your hats, folks! The Japanese yen took a nosedive after the Bank of Japan (BOJ) left its ultra-loose policy settings unchanged, including its closely watched yield curve control (YCC) policy. But wait, there's more! The BOJ also removed its forward guidance, which had previously pledged to keep interest rates at current or lower levels. So, what's the scoop? Market expectations had been subdued going into the meeting, but some were still hoping for tweaks to the forward guidance to prepare for an eventual exit from the bank's massive stimulus


Your request is accepted.
We will call you at the time interval that you chose
Next callback request for this phone number will be available in 00:30:00
If you have an urgent issue please contact us via
Live chat
Internal error. Please try again later