


Best Trade Ideas for April
I know we've had quite an amazing run these past few month, with over 78% accuracy in our trade ideas and sentiments, and thousands of pips in profits monthly...

Don’t waste your time – keep track of how NFP affects the US dollar!
Data Collection Notice
We maintain a record of your data to run this website. By clicking the button, you agree to our Privacy Policy.

Beginner Forex Book
Your ultimate guide through the world of trading.

Check Your Inbox!
In our email, you will find the Forex 101 book. Just tap the button to get it!
Risk warning: ᏟᖴᎠs are complex instruments and come with a high risk of losing money rapidly due to leverage.
66.43% of retail investor accounts lose money when trading ᏟᖴᎠs with this provider.
You should consider whether you understand how ᏟᖴᎠs work and whether you can afford to take the high risk of losing your money.
Warning! Old version of the browser!
Press one of the icons below to proceed to the official website of the developer and download the latest version of your browser.

Online Forex broker
Information is not investment advice
We have previously advised not to get too scared of a second-wave-caused stall in the stock market. Specifically, we suggested that 3 000 (2 980 to be precise) would serve as a likely bottom for the current sideways movement of the S&P and that this movement will be somewhat prolonged compared to similar periods in the previous several months. We are still maintaining that point. See the below chart.
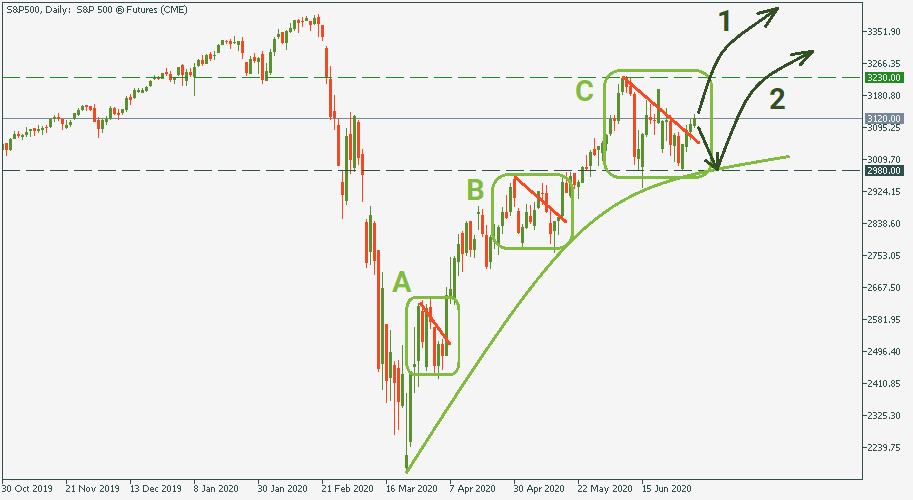
We had periods A and B where the S&P made a similar stop with lower-highs chart formations. Each time, it preceded a breakthrough growth to a higher baseline level. Currently, we are in the C-section. Even if it transforms into a breakthrough right now, it will already become the largest drawback among the three. Nevertheless, it doesn’t change the market logic. In fact, naturally, the higher and the closer the S&P’s trajectory gets to pre-virus dynamic, the less steep the inclination of the curve will be.
Hence, it is only reasonable to expect that the current sideways channel may take even longer before it completely exhausts itself. For this reason, and optimistic scenario 1 suggests that the current bullish move will be the beginning of a breakthrough to yet a higher baseline level. In the meantime, a moderate scenario 2 suggests that somewhere on the way to the resistance of 3 230 there will a bearish reversal, which still will convert into an upward trend after it bounces from the support at 2 980.
The long-term and mid-term projections provided by observers lately give enough positive fundamentals to consider both scenarios as quite possible. For this reason, get prepared, it looks like we are in for a good season at the stock market and the S&P.
I know we've had quite an amazing run these past few month, with over 78% accuracy in our trade ideas and sentiments, and thousands of pips in profits monthly...

Futures for Canada's main stock index rose on Monday, following positive global markets and gains in crude oil prices. First Citizens BancShares Inc's announcement of purchasing the loans and deposits of failed Silicon Valley Bank also boosted investor confidence in the global financial system...

Investor confidence in the global financial system has been shaken by the collapse of Silicon Valley Bank and Credit Suisse. As a result, many are turning to bearer assets, such as gold and bitcoin, to store value outside of the system without...

eurusd-is-falling-what-to-expect-from-the-future-price-movement

Greetings, fellow forex traders! Exciting news for those with an eye on the Australian market - the upcoming interest rate decision could be good news for Aussies looking to refinance or take out new loans. The Mortgage and Finance Association Australia CEO, Anja Pannek, has...

Hold onto your hats, folks! The Japanese yen took a nosedive after the Bank of Japan (BOJ) left its ultra-loose policy settings unchanged, including its closely watched yield curve control (YCC) policy. But wait, there's more! The BOJ also removed its forward guidance, which had previously pledged to keep interest rates at current or lower levels. So, what's the scoop? Market expectations had been subdued going into the meeting, but some were still hoping for tweaks to the forward guidance to prepare for an eventual exit from the bank's massive stimulus


Your request is accepted.
We will call you at the time interval that you chose
Next callback request for this phone number will be available in 00:30:00
If you have an urgent issue please contact us via
Live chat
Internal error. Please try again later