


EURUSD: Life after Parity
Recently, for the first time in two decades, the euro reached parity with the US dollar…

Don’t waste your time – keep track of how NFP affects the US dollar!
Data Collection Notice
We maintain a record of your data to run this website. By clicking the button, you agree to our Privacy Policy.

Beginner Forex Book
Your ultimate guide through the world of trading.

Check Your Inbox!
In our email, you will find the Forex 101 book. Just tap the button to get it!
Risk warning: ᏟᖴᎠs are complex instruments and come with a high risk of losing money rapidly due to leverage.
66.43% of retail investor accounts lose money when trading ᏟᖴᎠs with this provider.
You should consider whether you understand how ᏟᖴᎠs work and whether you can afford to take the high risk of losing your money.
Warning! Old version of the browser!
Press one of the icons below to proceed to the official website of the developer and download the latest version of your browser.

Online Forex broker
Information is not investment advice
More and more analysts are sure Brent oil will surpass $100 a barrel. Some of them forecast that $125 and $150 levels will be reached over several months. As oil is one of the most (if not the most) traded commodities in the world, it can't help but impact inflation and financial markets. At least, people think so. So how heavily will oil move the markets, and what will the direction of the movement be? Let's find out!
An increase in oil prices usually lowers the expected economic growth rate and increases inflation expectations over shorter horizons. Decreasing economic growth prospects, in turn, reduces companies' earnings expectations, resulting in a dampening effect on stock prices. But that's in theory. So let's look at the correlation meter to find out the truth.
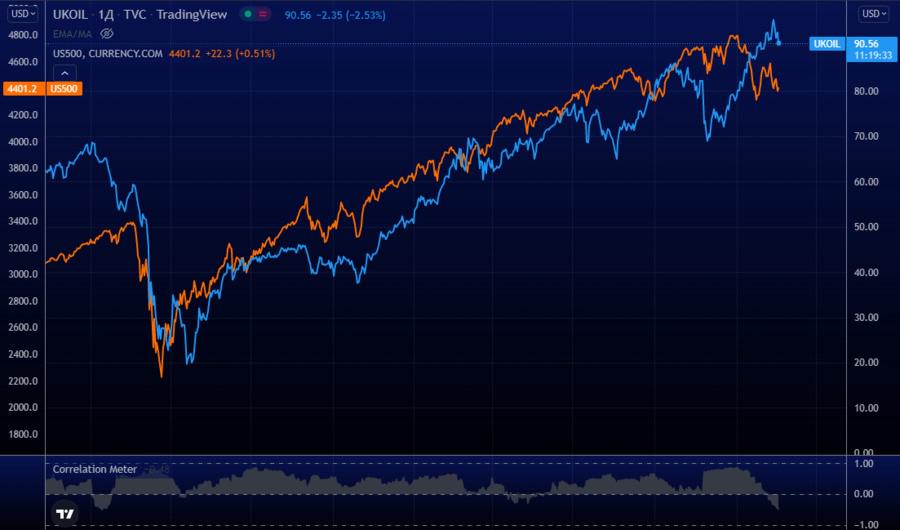
Here you can see S&P500 (US500) index (orange) compared with XBR/USD (UK Brent oil, blue). In addition, you can find a correlation meter at the bottom of the screen, a tool to measure the correlation between instruments and assets. It is evident that since the crash in March 2020, both US500 and XBR/USD have had a positive correlation. It is opposite to the market expectations of oil and stock price movement and shows that high oil prices don't always mean a slump in stocks.
We searched the web and found out that researchers at the Federal Reserve Bank of Cleveland looked at movements in the price of oil and stock market prices and discovered that there is little correlation between oil prices and the stock market.
Also, it would be best if you separate correlation and causation. Oil does impact the US economy, but this impact is bidirectional. On the one hand, high oil prices create more jobs in the oil industry and increase investments in shale oil deposits. On the other hand, high oil prices also hit businesses and consumers with higher transportation and manufacturing costs. To be more specific, we can assume that change in oil prices causes money transfer from energy-consuming companies to oil production and vice versa. Oil doesn't drive stock prices because other price factors in the economy—such as wages, interest rates, industrial metals, plastic, and computer technology—can offset changes in energy costs.
In other words, the economy is too complex to expect one commodity to drive all business activity in a predictable way.
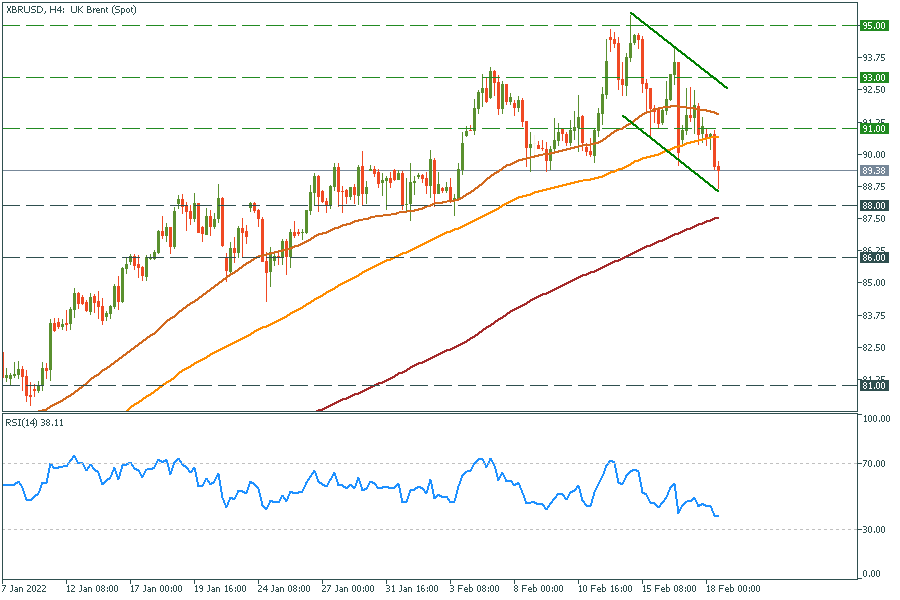
Technically, oil is in a consolidation. A breakout of the $93.00 level will turn on the bullish scenario. However, considering the negative correlation with US500 at the present moment, the latter may decrease even more. The oil may move higher to the resistance of $91.00 per barrel in the short term.
XBR/USD H4 chart
Resistance: 91.00, 93.00, 95.00;
Support: 88.00, 86.00, 81.00
Don't know how to trade oil? Here are some simple steps.

Recently, for the first time in two decades, the euro reached parity with the US dollar…

The second earnings season of 2022 has almost begun. From banks and tech stocks to cars and the retail sector: in this outlook, we covered the most promising releases of this summer and made several projections on the companies’ prospects.

The stock market has reversed, and now it’s going lower and lower…

eurusd-is-falling-what-to-expect-from-the-future-price-movement

Greetings, fellow forex traders! Exciting news for those with an eye on the Australian market - the upcoming interest rate decision could be good news for Aussies looking to refinance or take out new loans. The Mortgage and Finance Association Australia CEO, Anja Pannek, has...

Hold onto your hats, folks! The Japanese yen took a nosedive after the Bank of Japan (BOJ) left its ultra-loose policy settings unchanged, including its closely watched yield curve control (YCC) policy. But wait, there's more! The BOJ also removed its forward guidance, which had previously pledged to keep interest rates at current or lower levels. So, what's the scoop? Market expectations had been subdued going into the meeting, but some were still hoping for tweaks to the forward guidance to prepare for an eventual exit from the bank's massive stimulus


Your request is accepted.
We will call you at the time interval that you chose
Next callback request for this phone number will be available in 00:30:00
If you have an urgent issue please contact us via
Live chat
Internal error. Please try again later