


Williams’ Strategy
Bill Williams is the creator of some of the most popular market indicators: Awesome Oscillator, Fractals, Alligator, and Gator.

Don’t waste your time – keep track of how NFP affects the US dollar!
Data Collection Notice
We maintain a record of your data to run this website. By clicking the button, you agree to our Privacy Policy.

Beginner Forex Book
Your ultimate guide through the world of trading.

Check Your Inbox!
In our email, you will find the Forex 101 book. Just tap the button to get it!
Risk warning: ᏟᖴᎠs are complex instruments and come with a high risk of losing money rapidly due to leverage.
70.72% of retail investor accounts lose money when trading ᏟᖴᎠs with this provider.
You should consider whether you understand how ᏟᖴᎠs work and whether you can afford to take the high risk of losing your money.
Warning! Old version of the browser!
Press one of the icons below to proceed to the official website of the developer and download the latest version of your browser.

Online Forex broker
Information is not investment advice
Among hundreds of different indicators and technical tools for traders, the relative strength index (RSI) is one of the most popular due to its simplicity and, at the same time, its power in various trading cases. In this article, we want to tell you about another powerful tool similar to RSI but with some cool tweaks. It’s called the Money Flow Index (MFI), and you definitely should know about it as this index can take your trading to a new level and provide tons of valuable entry and exit points.
Money Flow Index (MFI) is a technical indicator that gives you the rate at which money is going in and out of a security. The main difference from the RSI is that the MFI uses volumes as a part of calculations, which can be quite helpful as volumes provide a better outlook on the market sentiment. Generally, the MFI is a mid-term instrument that works best on the H4 and higher timeframes, but skilled traders may use it for short-term trades as well.
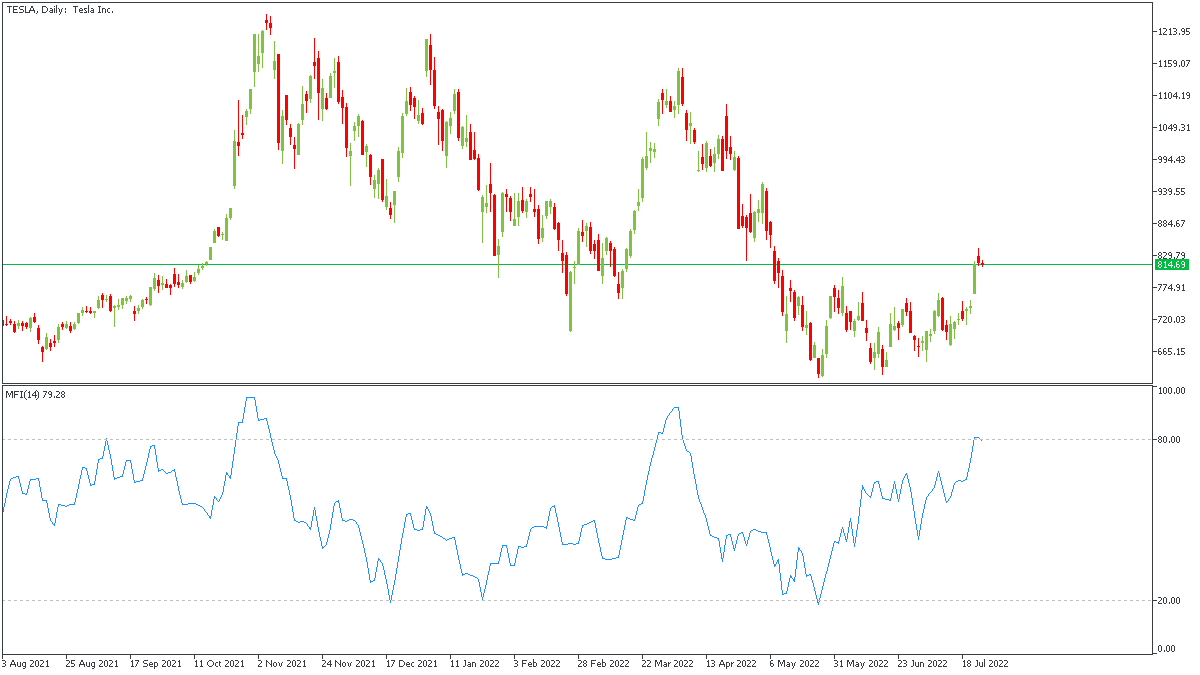
It’s critical for successful trading to keep in mind that MetaTrader doesn’t provide you with accurate market volumes. It uses a “tick volume,” which can significantly differ from the “real volume.” Although we will be using MT5 to show you the indicator, some screenshots from TradingView (TV) will also be in the article because TV provides accurate volumes from the biggest exchanges like NASDAQ, NYSE, CME, etc.
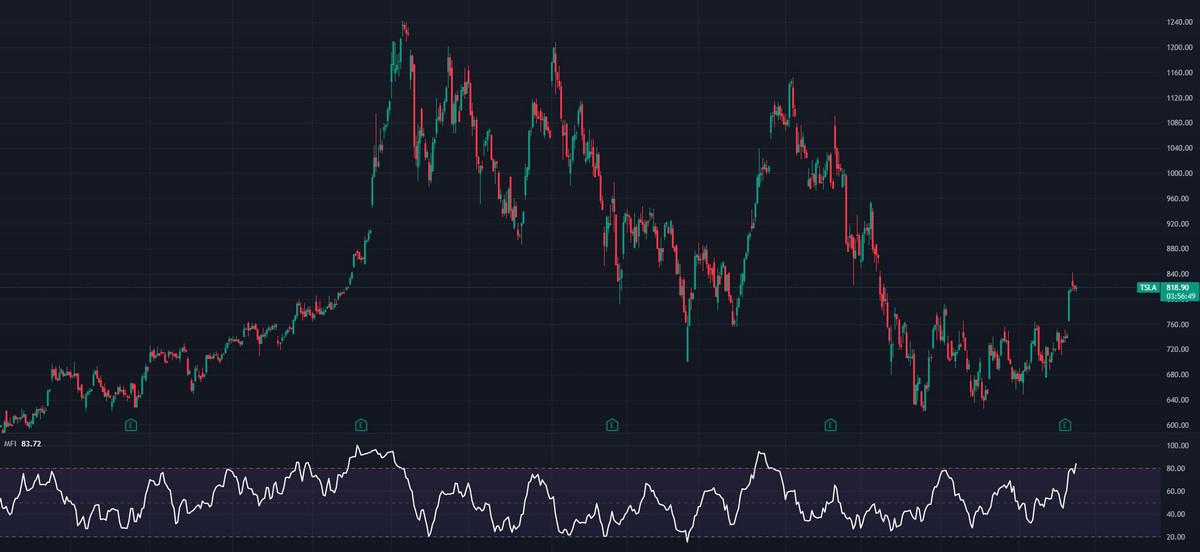
Source: tradingview.com
MetaTrader has slightly smoothed readings closer to the line of 50 and sharper edges on peaks. You can use whatever you find more suitable; we only wanted to inform you about another way to use the oscillator.
Back to the Money Flow Index. The similarities with the relative strength index don’t end in the calculation methods. MFI is also a momentum indicator that helps to identify the upcoming pullback or trend change in an asset. Like the RSI, the MFI has bullish and bearish divergences, overbought and oversold zones, and oscillates around the zero line. You can use the money flow index to identify the start of the accumulation or distribution phase if you know how to use smart money concepts.
The MFI calculation follows four steps as below:
TP = (HIGH + LOW + CLOSE)/3
MF = TP * VOLUME
If the current typical price is larger than the preceding typical price, then the money flow is positive, and vice versa. A positive flow implies that investors are building up positions on the underlying asset, whereas a negative money flow suggests that investors are exiting positions in the underlying asset.
MR = Positive Money Flow (PMF)/Negative Money Flow (NMF)
MFI = 100 – (100 / (1 + MR))
The default time period of the MFI is 14, with the minimum at 0 and the maximum at 100. This means that the MFI value will oscillate between 0 and 100.
To get the oscillator working, you must repeat the calculations above for the last 14 periods. It’s obvious that nobody would calculate the index by himself every time. Although the calculations are not too complex, we provide them only to understand the indicator better. We better switch to the part about reading the index and understanding it.
The money Flow Index indicates the percentage of positive money flow compared to the total money flow. When the current typical price is higher than the previous one, it is considered positive money flow, and vice versa.
The MFI is an oscillator; we should read it like every other similar indicator. Readings above the 80 level represent an overbought zone and signal about possible downside reversal. The same goes for the level of 20 and lower. It’s the oversold zone with a higher chance of an upside swing.
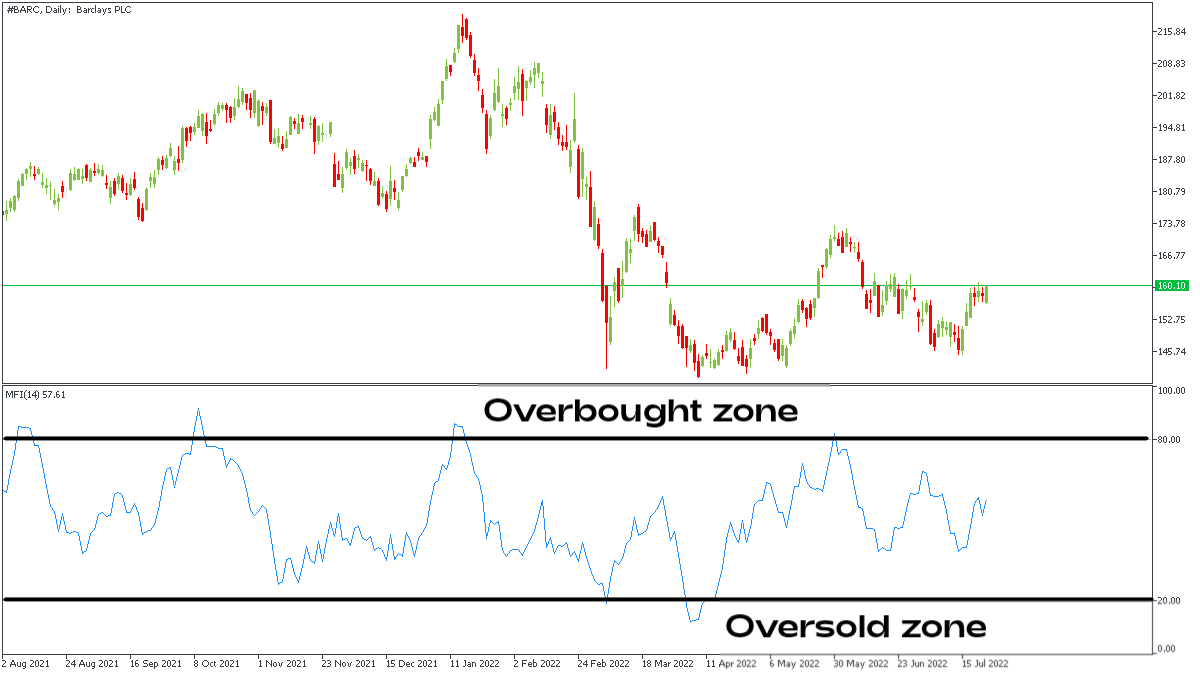
The creators of the MFI initially recommended the 10 and 90 levels as indicators of oversold and overbought levels. Although the price rarely reaches these levels, seeking them is more reliable because the extreme overbought and oversold states (>90 and <10) indicate an even higher reversal chance.
In addition, you can mark the level of 50 on the MFI to define the pressure from buyers and sellers. Readings above 50 indicate buying pressure and vice versa.
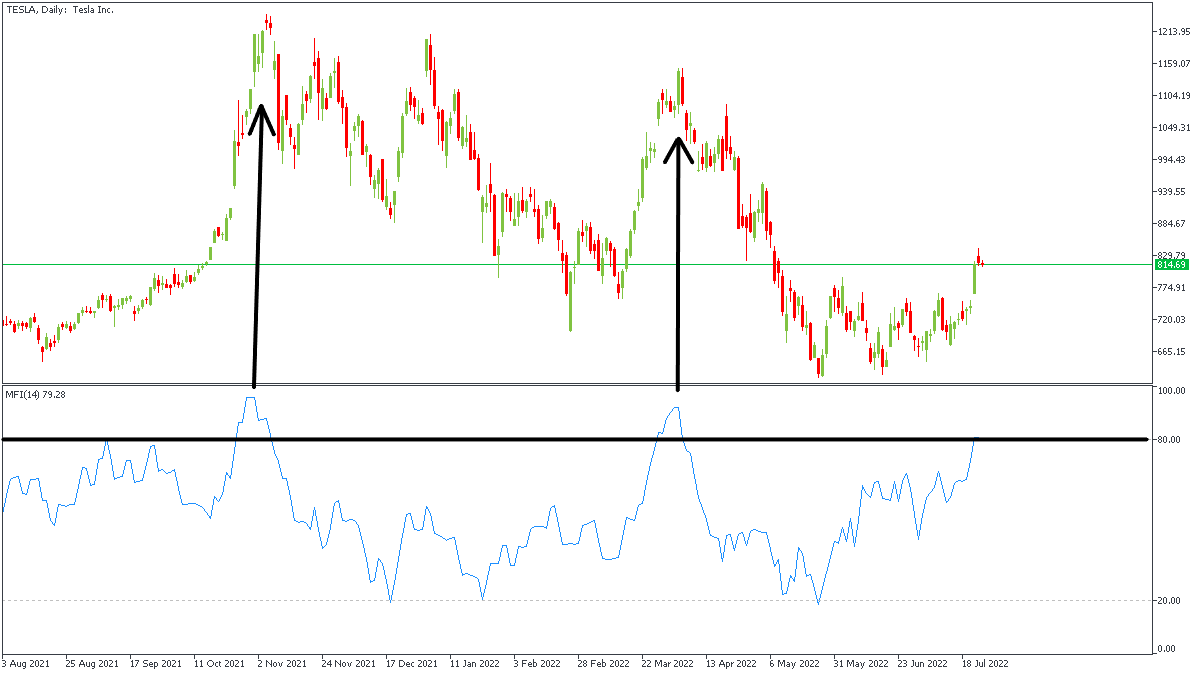
As the Money Flow Index is quite similar to RSI, the indicator can be used similarly. The MFI can offer traders several signals, including overbought, oversold, and divergences. When the MFI goes above 80 (or 90 in some strategies), you can consider this a sell signal.
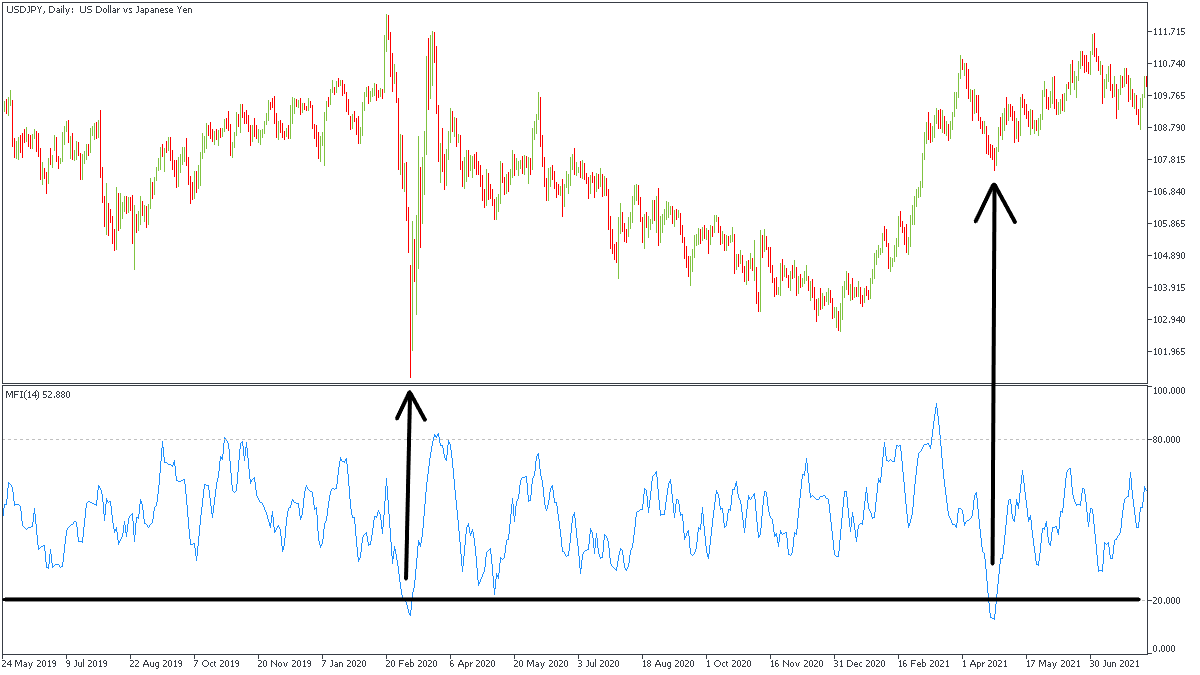
The same goes in the other direction. When the MFI slides below 20 (10 in some strategies), we consider this an entry into the oversold zone. Thus, you may start looking for buy trades.
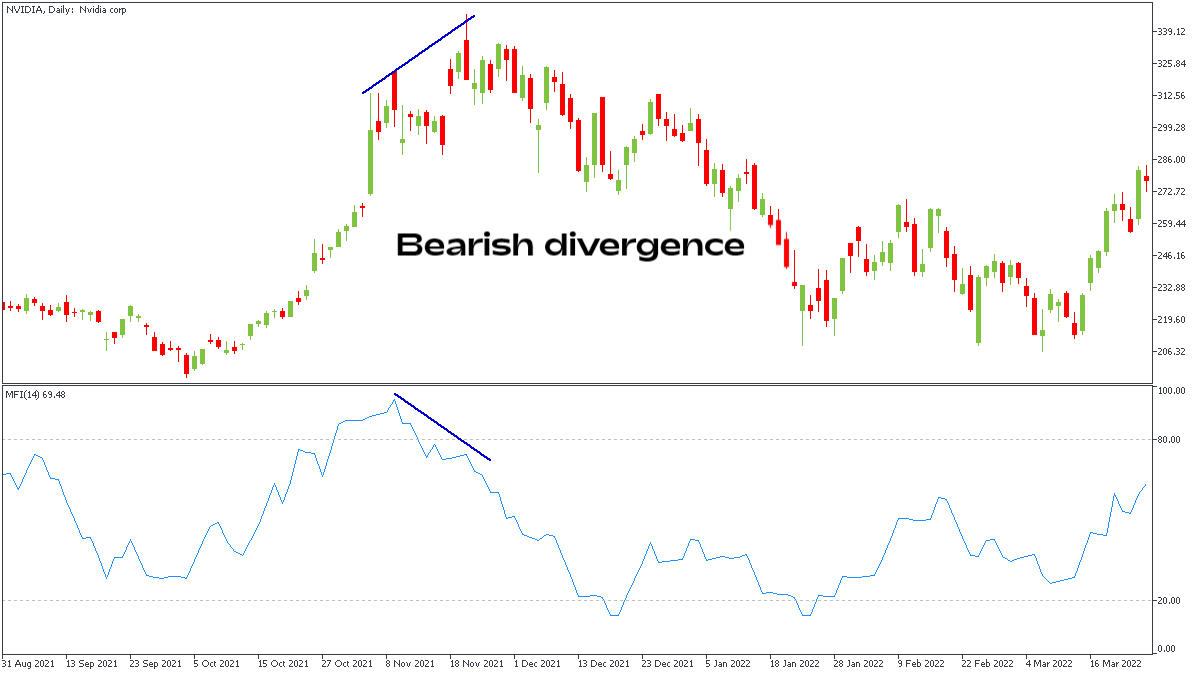
Nevertheless, sometimes, looking for overbought and oversold zones cannot be enough for you. In this case, try using classic RSI divergences on the MFI. Look for the higher highs of the chart and lower highs on the MFI to find a bearish divergence. Then, you can add your trading strategy to find an entry point.
Bullish divergence is just the same. Look for lower lows on the chart and higher lows on the MFI to find it and seek an entry point for a buy trade. Notice that bearish divergence appears at the end of an uptrend, and bullish divergence can be found at the bottom (end of the downtrend).
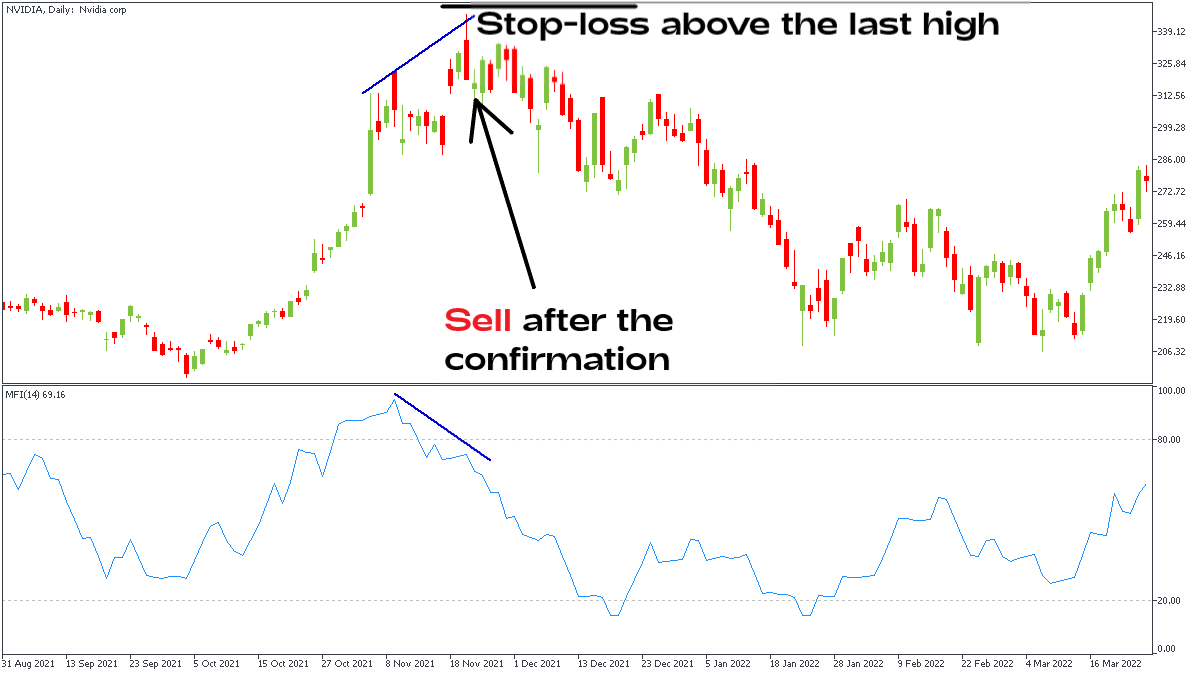
We think the divergence trading strategy is one of the best for the money flow index. Let’s look at the chart to find entry and exit points. As soon as we spot the divergence, consider selling the asset (in our case, it’s NVIDIA stock). We should sell the instrument only after the candle close. Lucky us, it was a bearish engulfing, and now we are even more sure in the bearish scenario.
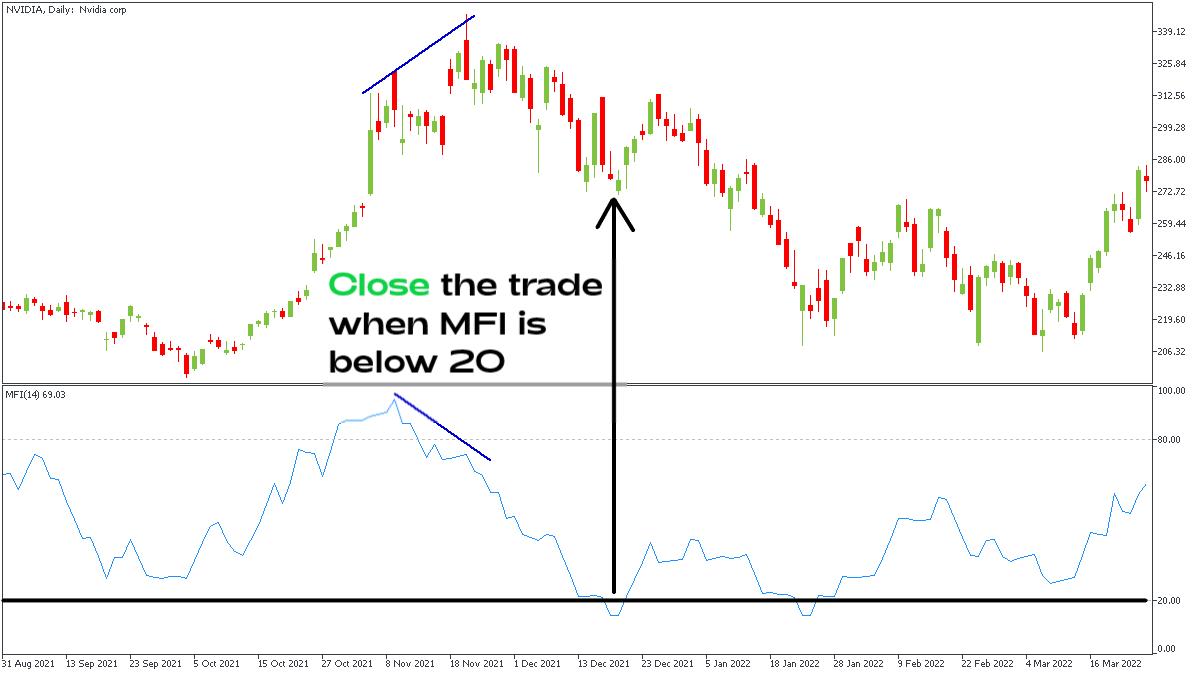
Now we are in the position and should wait for the signal to close the trade. The simplest way is to wait for the MFI to slide below 20 and indicate the end of the selling activity. The stock went even lower later, but it’s unimportant because we still had a profitable and reliable trade. It would be best if we took the whole movement, but we should be happy with what we got.
Don’t hesitate to close part of your trade halfway to the Take Profit and move your Stop Loss to breakeven. This way, you make your trade risk-free and can afford to hold it longer, potentially opening a path to bigger returns.
Money Flow Index is a great way to enhance your trading, especially if you’re familiar with the RSI trading strategies. The MFI provides fewer signals than the RSI, but the tested MFI strategy works just great. As a partly volume indicator, we look very much forward to testing it on all possible assets. Here’re some tips for you to keep in mind:

Bill Williams is the creator of some of the most popular market indicators: Awesome Oscillator, Fractals, Alligator, and Gator.

Trend strategies are good - they may give significantly good results in any time frame and with any assets. The main idea of the ADX Trend-Based strategy is to try to catch the beginning of the trend.

Counter-trend strategies are always the most dangerous but also the most profitable. We are pleased to present an excellent counter-trend strategy for working in any market and with any assets.

eurusd-is-falling-what-to-expect-from-the-future-price-movement

Greetings, fellow forex traders! Exciting news for those with an eye on the Australian market - the upcoming interest rate decision could be good news for Aussies looking to refinance or take out new loans. The Mortgage and Finance Association Australia CEO, Anja Pannek, has...

Hold onto your hats, folks! The Japanese yen took a nosedive after the Bank of Japan (BOJ) left its ultra-loose policy settings unchanged, including its closely watched yield curve control (YCC) policy. But wait, there's more! The BOJ also removed its forward guidance, which had previously pledged to keep interest rates at current or lower levels. So, what's the scoop? Market expectations had been subdued going into the meeting, but some were still hoping for tweaks to the forward guidance to prepare for an eventual exit from the bank's massive stimulus


Your request is accepted.
We will call you at the time interval that you chose
Next callback request for this phone number will be available in 00:30:00
If you have an urgent issue please contact us via
Live chat
Internal error. Please try again later