
Best Trade Ideas for April
I know we've had quite an amazing run these past few month, with over 78% accuracy in our trade ideas and sentiments, and thousands of pips in profits monthly...

Don’t waste your time – keep track of how NFP affects the US dollar!
Data Collection Notice
We maintain a record of your data to run this website. By clicking the button, you agree to our Privacy Policy.

Beginner Forex Book
Your ultimate guide through the world of trading.

Check Your Inbox!
In our email, you will find the Forex 101 book. Just tap the button to get it!
Risk warning: ᏟᖴᎠs are complex instruments and come with a high risk of losing money rapidly due to leverage.
68.53% of retail investor accounts lose money when trading ᏟᖴᎠs with this provider.
You should consider whether you understand how ᏟᖴᎠs work and whether you can afford to take the high risk of losing your money.
Warning! Old version of the browser!
Press one of the icons below to proceed to the official website of the developer and download the latest version of your browser.

Online Forex broker
Information is not investment advice
We discussed previously some of the trend reversal chart formations. Hammer is one of them. Speaking about its composition, it has two parts: a head and a grip. These are essential to interpret it correctly. Normally, it a hammer's head is lower as if it was falling - that's a bearish reversal coming. If the head is above and the grip is below - bulls are taking over. Let's check through some particular examples.

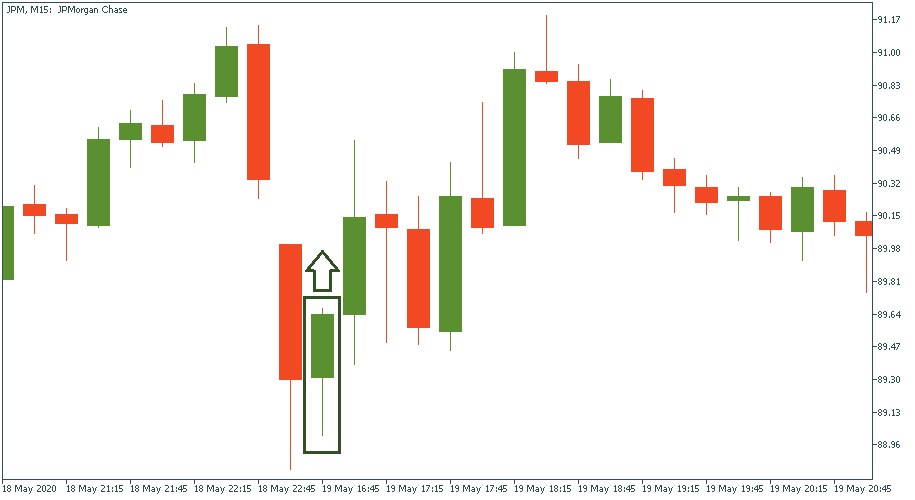
An ideal scenario is a clear green/bullish hammer with a head pointing upwards. That’s a classic example of a hammer formation predicting an upward reversal. In the M15 chart of JPMorgan stock price, this reversal is quick to come – and quick to leave.
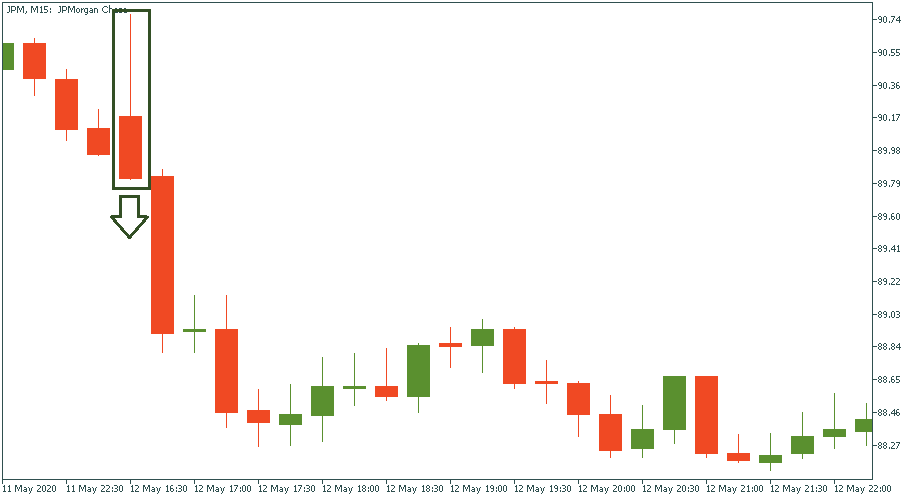
For a downtrend, we have the same logic. A clear red/bearish hammer with a head pointing down – that’s a sign of a downtrend. In this particular chart, it comes immediately after the hammer but stops a few candlesticks later.
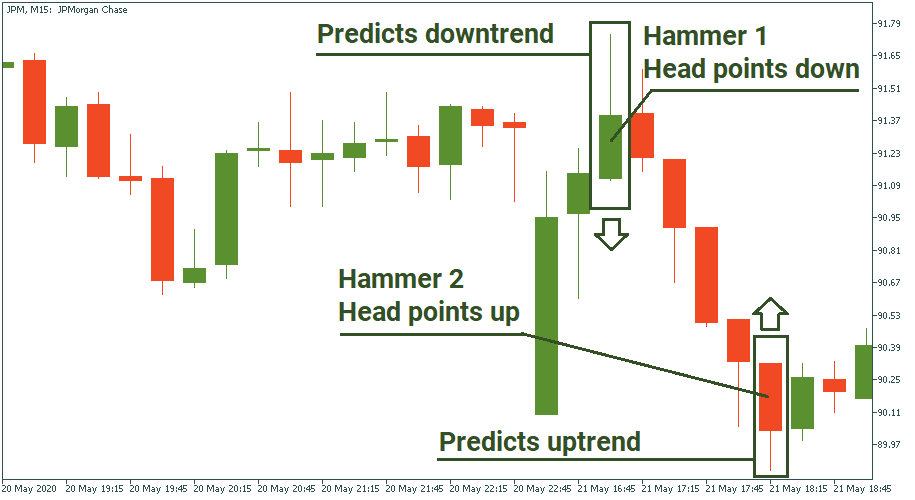
There are cases when the color of the hammer candlestick contradicts its direction. In this case, we disregard its color and take its direction as a basis for interpretation.
In the JPMorgan chart below, we see hammer 1 formed as a green/bullish candle. Nevertheless, its head points downwards. Hence, leaving the color aside, this candle should be taken as a bearish sign – and so it eventually fulfills. The second hammer formation comes here as a red/bearish candle. But as long as its head points upwards, it is a bullish sign – and so it happens straight after.
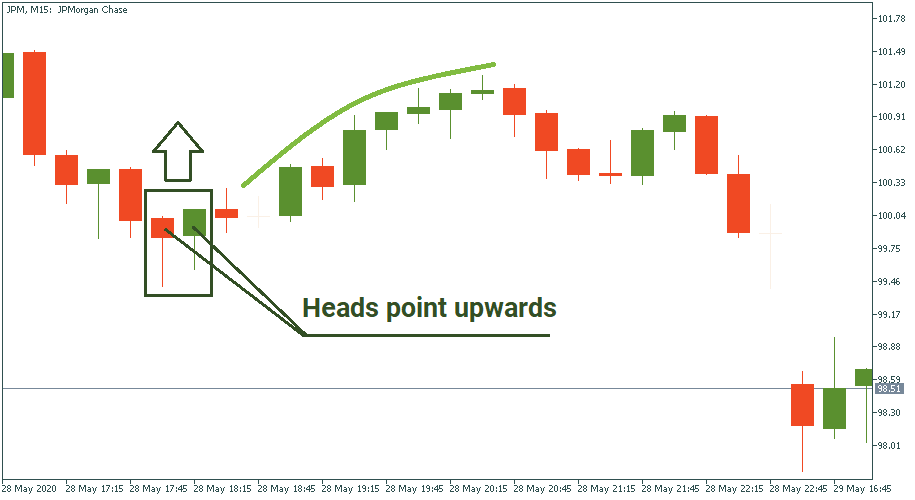
Sometimes, hammer candles come one after another. That’s a stronger confirmation of the observed direction if both agree where they point at. In the below example, a red/bearish and a green/bullish hammer stand one next to another, and both have their heads point upwards: that means both confirm the upside potential. Immediately after, it takes place, although for not too long.
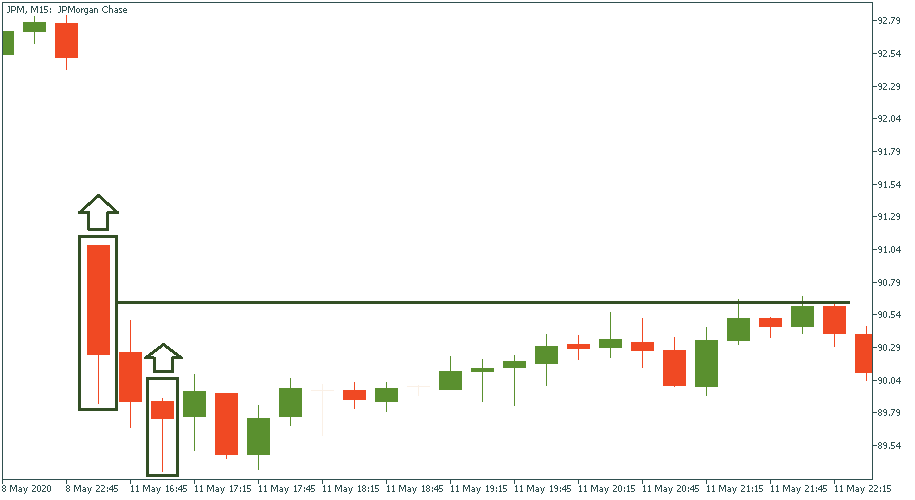
You will encounter a lot of cases when the trend change predicted by hammer formation is not only short-lived but also weak or even insignificant. On the M15 chart of JPMorgan below, we see two hammers pointing upwards. In theory, that should come as a strong sign of a bullish reversal. Eventually, there is indeed a reversal but it is so weak that the highest point of this upward correction hardly reaches the middle of the first hammer’s head.
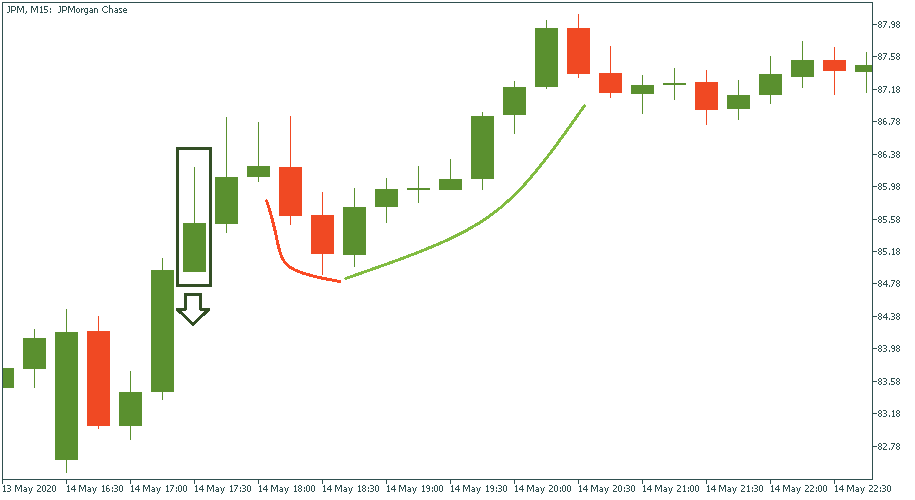
You will also come across hammer formations that result to have no predictive power. In the chart below, the observed hammer is supposed to bring a bearish reversal, but after just two bearish candles not even crossing the low of the hammer, the trend goes upwards.
Hammer formation is ease to notice and use. However, it does have its limitations in terms of its predictive probability. It may be said that it works more often than it doesn’t, that’s why it is a good instrument in trader’s toolkit.
I know we've had quite an amazing run these past few month, with over 78% accuracy in our trade ideas and sentiments, and thousands of pips in profits monthly...
Futures for Canada's main stock index rose on Monday, following positive global markets and gains in crude oil prices. First Citizens BancShares Inc's announcement of purchasing the loans and deposits of failed Silicon Valley Bank also boosted investor confidence in the global financial system...

Investor confidence in the global financial system has been shaken by the collapse of Silicon Valley Bank and Credit Suisse. As a result, many are turning to bearer assets, such as gold and bitcoin, to store value outside of the system without...

eurusd-is-falling-what-to-expect-from-the-future-price-movement

Greetings, fellow forex traders! Exciting news for those with an eye on the Australian market - the upcoming interest rate decision could be good news for Aussies looking to refinance or take out new loans. The Mortgage and Finance Association Australia CEO, Anja Pannek, has...

Hold onto your hats, folks! The Japanese yen took a nosedive after the Bank of Japan (BOJ) left its ultra-loose policy settings unchanged, including its closely watched yield curve control (YCC) policy. But wait, there's more! The BOJ also removed its forward guidance, which had previously pledged to keep interest rates at current or lower levels. So, what's the scoop? Market expectations had been subdued going into the meeting, but some were still hoping for tweaks to the forward guidance to prepare for an eventual exit from the bank's massive stimulus


Your request is accepted.
We will call you at the time interval that you chose
Next callback request for this phone number will be available in 00:30:00
If you have an urgent issue please contact us via
Live chat
Internal error. Please try again later