


Williams’ Strategy
Bill Williams is the creator of some of the most popular market indicators: Awesome Oscillator, Fractals, Alligator, and Gator.

Don’t waste your time – keep track of how NFP affects the US dollar!
Data Collection Notice
We maintain a record of your data to run this website. By clicking the button, you agree to our Privacy Policy.

Beginner Forex Book
Your ultimate guide through the world of trading.

Check Your Inbox!
In our email, you will find the Forex 101 book. Just tap the button to get it!
Risk warning: ᏟᖴᎠs are complex instruments and come with a high risk of losing money rapidly due to leverage.
70.72% of retail investor accounts lose money when trading ᏟᖴᎠs with this provider.
You should consider whether you understand how ᏟᖴᎠs work and whether you can afford to take the high risk of losing your money.
Warning! Old version of the browser!
Press one of the icons below to proceed to the official website of the developer and download the latest version of your browser.

Online Forex broker
Information is not investment advice
If you trade stocks, you have the information about the volumes of trading provided by a stock exchange. This info allows you to see whether market players back up a price’s trend or not. On the currency market, the situation is different but traders can still get insights from volumes.
Forex market is decentralized so it’s not possible to count all the contracts and their sizes like it’s done at stock markets. As a result, Forex traders use indicators of tick volume.
A tick is any single change or movement in the quote up or down. MetaTrader measures the number of ticks during a single period of time. Thus it’s possible to see how actively the market traded in particular moments. In other words, we don’t know whether there were 500 or 500,000 orders within a certain period, but we know how many ticks the price moved. This is what a tick volume is. It’s important to understand its nature.
MetaTrader offers several indicators of tick volume. To apply them, click “Insert”, then “Indicators” and choose “Volumes”. There are 4 indicators:
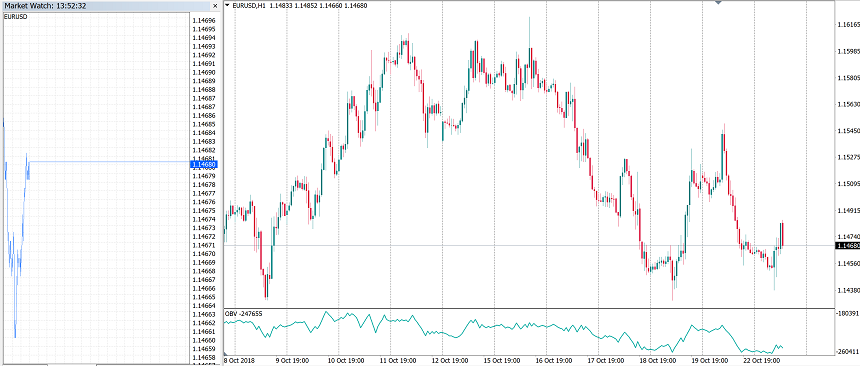
The indicator shows the number of price changes (ticks) within each period of a selected timeframe. Volume bars are painted green if they are bigger than the previous ones and red if volume declines.
The indicator is represented in form of a line. If the close price of the current candlestick is higher than that of the previous one, the current volume is added to the previous OBV and the line goes up. If the current candlestick close price is lower than of the previous one, the current volume is subtracted from the previous OBV making the indicator go down. It’s assumed that OBV changes precede price changes, so it can provide signals.
The indicator shows the rate at which money is piled into an asset and then withdrawn from it. Regard it as a version of RSI that takes into account volumes.
This is another indicator calculated on the basis of both price and volume. The higher the volume, the greater the contribution of the price change (for this period of time) will make to the value of the indicator.
Volume indicators can perform very useful tasks:
1. Measure the strength of a trend
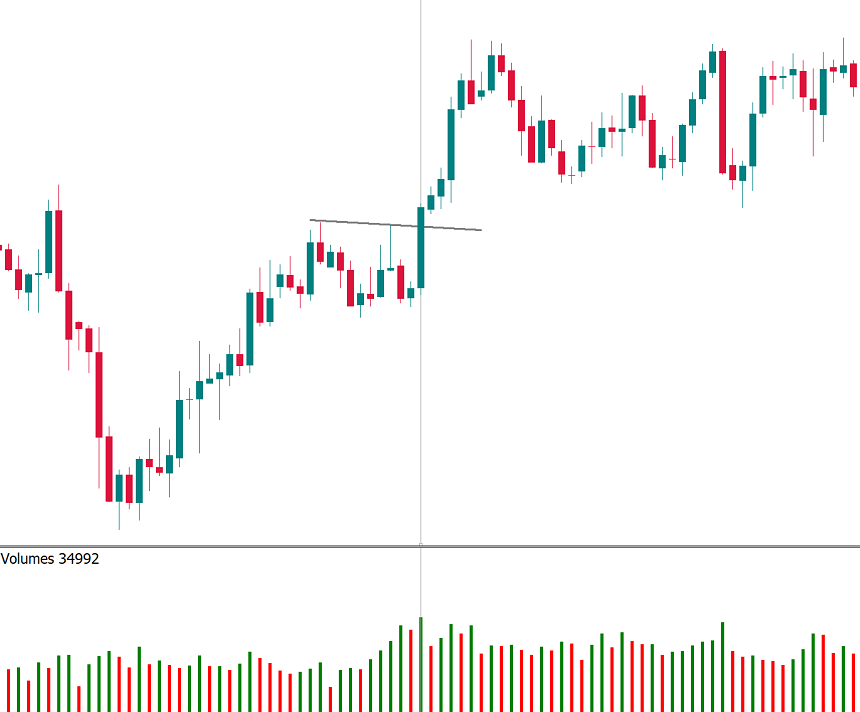
A trend is strong when it’s confirmed by rising volume because it means that the market’s interest in this trend is high. So, in an uptrend, volume should increase when the price is moving up and decrease when the price is moving down, while in a downtrend this means increased volume when the price is moving down and decreased volume when the price is moving up.
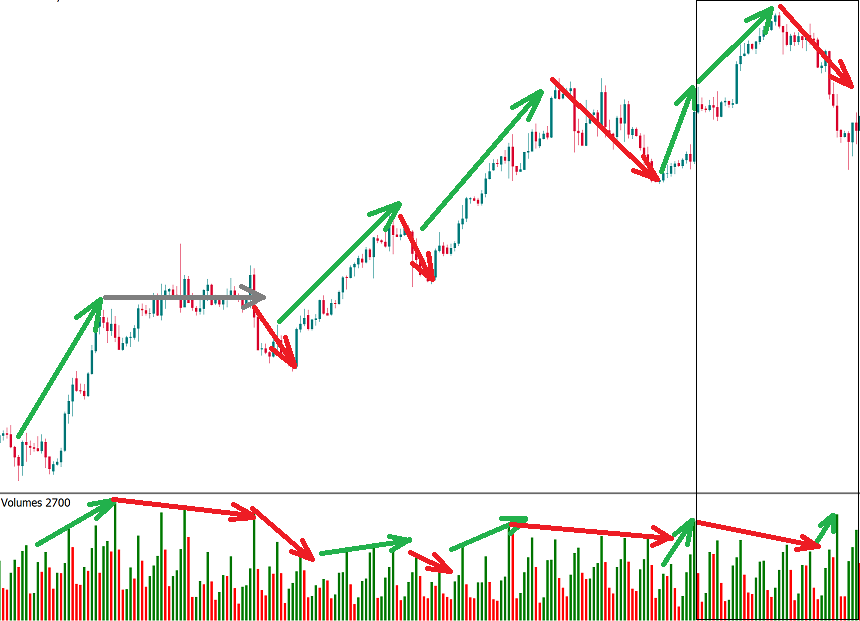
At the picture above you can see that volume declines during corrections in an uptrend. In the final part of the chart, the new high is not confirmed by volume. It means a likely reversal down.
2. Spot reversals early
It’s always difficult to distinguish between a reversal and a correction at an early stage. Volume indicators help to do it sooner and join the new trend as early as possible.
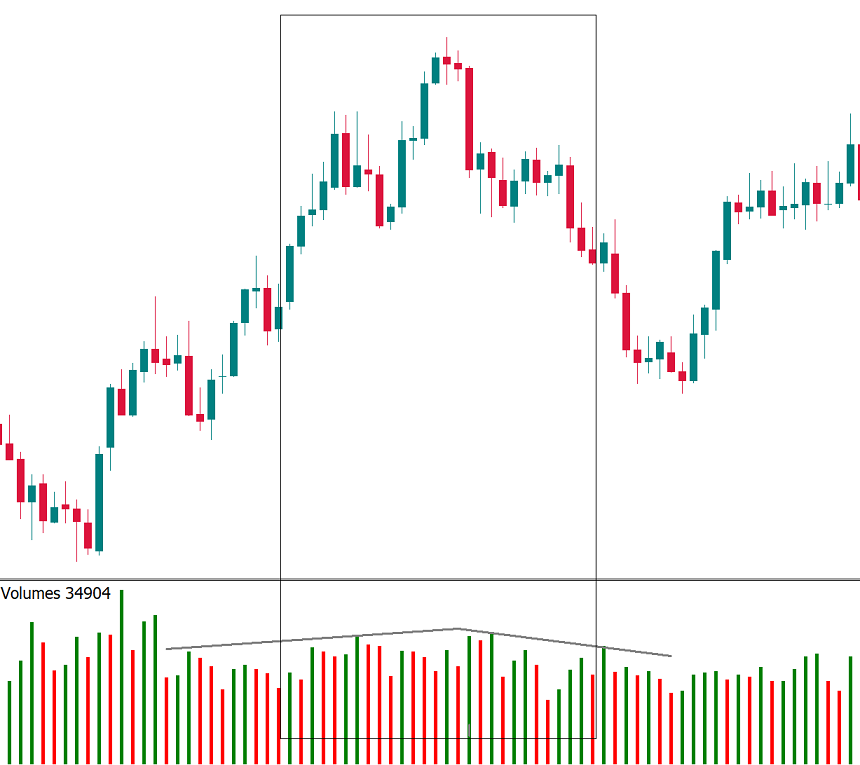
The price formed a “Head and Shoulders” pattern. Volume was low during the top and even lower at the second shoulder: a confirmation that the market had no more strength to go up.
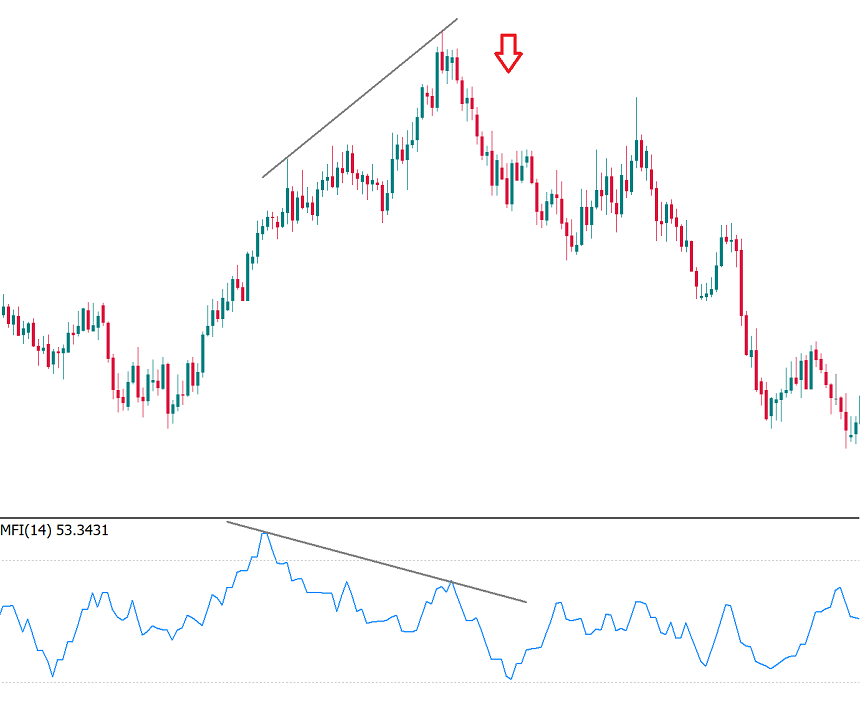
If there’s a divergence between the price and the volume indicator, it’s a signal of a potential reversal of the existing trend.
3. Confirm a breakout
Volumes are usually low during a consolidation period. If a breakthrough of a range is accompanied by a spike in volume, there’s a higher chance that this is a real and not a false breakout.
Volume rose at the moment when the price went above a resistance level. This helped the price continue moving in the direction of a breakthrough.
4. Identify strong areas of support/resistance
The areas where the price is trading with high volumes may represent significant obstacles on the way of the price and, consequently, good entry and exit level for traders.
Conclusion
Volume indicators in MetaTrader are not independent signals providers but they can be used for confirmation. After all, the dynamics of volume tells us better than anything how active the trading is. This is a unique knowledge which is not really provided by other indicators. As a result, the indicators of volume will surely make a great contribution to your trading system.

Bill Williams is the creator of some of the most popular market indicators: Awesome Oscillator, Fractals, Alligator, and Gator.

Trend strategies are good - they may give significantly good results in any time frame and with any assets. The main idea of the ADX Trend-Based strategy is to try to catch the beginning of the trend.

Counter-trend strategies are always the most dangerous but also the most profitable. We are pleased to present an excellent counter-trend strategy for working in any market and with any assets.

eurusd-is-falling-what-to-expect-from-the-future-price-movement

Greetings, fellow forex traders! Exciting news for those with an eye on the Australian market - the upcoming interest rate decision could be good news for Aussies looking to refinance or take out new loans. The Mortgage and Finance Association Australia CEO, Anja Pannek, has...

Hold onto your hats, folks! The Japanese yen took a nosedive after the Bank of Japan (BOJ) left its ultra-loose policy settings unchanged, including its closely watched yield curve control (YCC) policy. But wait, there's more! The BOJ also removed its forward guidance, which had previously pledged to keep interest rates at current or lower levels. So, what's the scoop? Market expectations had been subdued going into the meeting, but some were still hoping for tweaks to the forward guidance to prepare for an eventual exit from the bank's massive stimulus


Your request is accepted.
We will call you at the time interval that you chose
Next callback request for this phone number will be available in 00:30:00
If you have an urgent issue please contact us via
Live chat
Internal error. Please try again later