

Williams’ Strategy
Bill Williams is the creator of some of the most popular market indicators: Awesome Oscillator, Fractals, Alligator, and Gator.

Don’t waste your time – keep track of how NFP affects the US dollar!
Data Collection Notice
We maintain a record of your data to run this website. By clicking the button, you agree to our Privacy Policy.

Beginner Forex Book
Your ultimate guide through the world of trading.

Check Your Inbox!
In our email, you will find the Forex 101 book. Just tap the button to get it!
Risk warning: ᏟᖴᎠs are complex instruments and come with a high risk of losing money rapidly due to leverage.
70.72% of retail investor accounts lose money when trading ᏟᖴᎠs with this provider.
You should consider whether you understand how ᏟᖴᎠs work and whether you can afford to take the high risk of losing your money.
Warning! Old version of the browser!
Press one of the icons below to proceed to the official website of the developer and download the latest version of your browser.

Online Forex broker
Information is not investment advice
The gold trading is not a very easy topic, as the yellow metal does not move the same way as the other commodities or the currency pairs on the Forex market. However, there are some well-known strategies which can be used to succeed in gold trading.
Besides the usual statistics, gold is affected by political and economic factors, global disasters, terrorist attacks, and crises. The reason is that gold has tight connections with different markets: equity or raw materials.
The dynamics of gold prices do not follow the usual logic. Trading on the news can be successful only after the major releases or events. It is highly recommended not to open the position immediately after the event, because you do not know where the price will go. For example, the sharp fall in the equity market results in the rise of the gold price. As a result, you can make long positions.
It’s not a secret gold has a strong negative correlation with the US dollar. That means, gold and the US dollar move in the opposite direction. The buy signal for gold means the sell signal for the USD and vice versa. A good thing to know is that one of the forms ahead of the other one and you can take a chance to make a profit.
Here is the strategy to trade the Gold using its correlation with the USD.
Take a note, that sometimes you can find a resistance line on the USD/JPY chart, but cannot determine any visible support on the gold chart. However, the breakout of the resistance on USD/JPY chart will be followed by a sell signal on the Gold chart. Therefore, if the USD is strong on USD/JPY, it will signal to sell the gold.
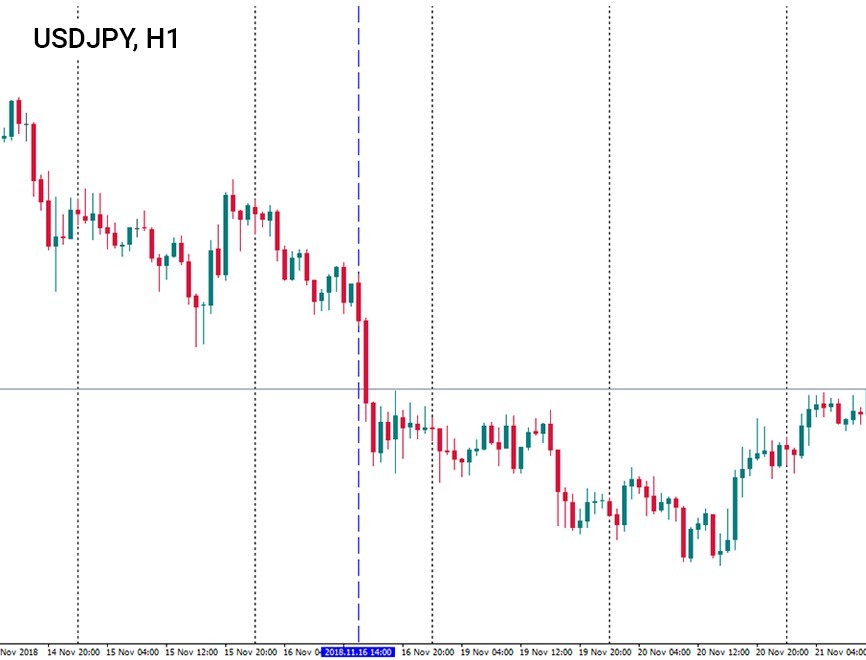
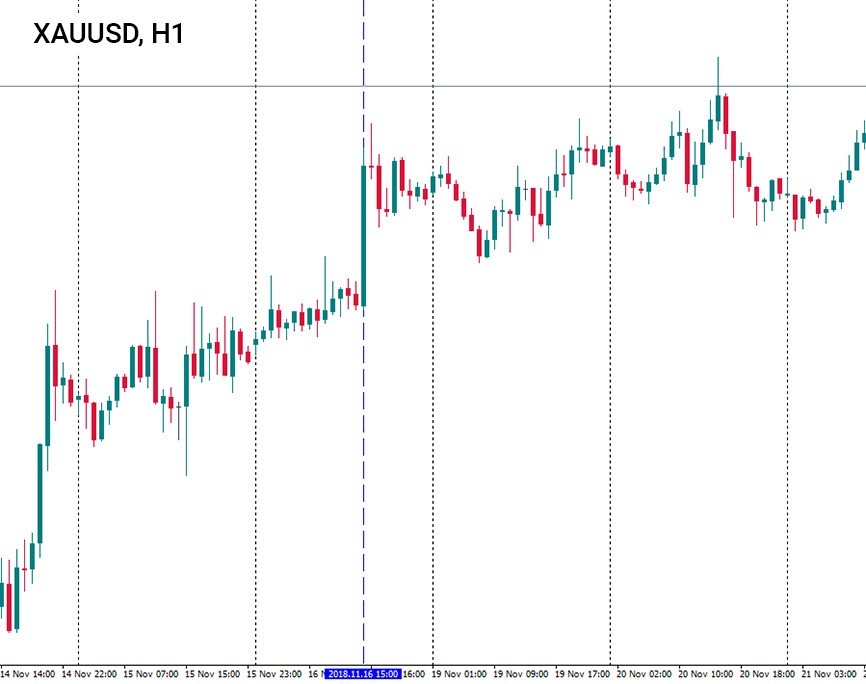
On the H1 chart of USD/JPY, a bearish candlestick was formed. It gave a strong signal to buy gold. If a trader takes this opportunity, he can make a good profit on the rising price of gold.
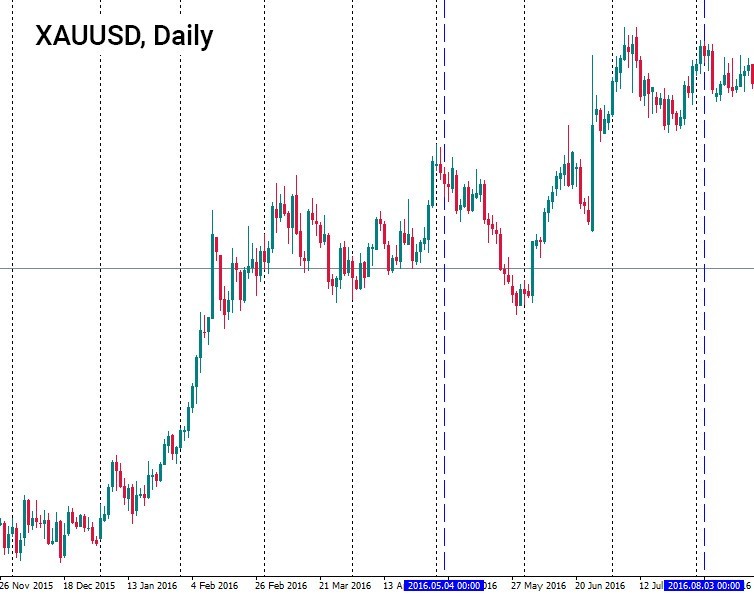
On the other hand, gold has a positive correlation with AUD/USD. Australia is known as one of the largest gold producers in the world. That is why the Reserve bank of Australia should keep its gold reserves in balance. The gold reacts to Australian fundamental data or monetary policy changes made by the Reserve bank of Australia. On the picture below, the interest rate cuts made in 2016 resulted in the selling of the gold.
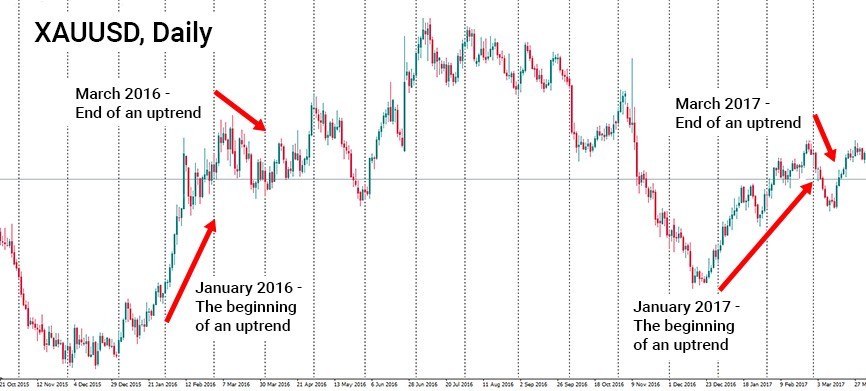
The price movements of gold are correlated with its seasonal pattern. Gold can be stronger during certain times of the year and weaker during the other times. Moreover, these periods repeat themselves during the same parts of the year. Gold tends to go up in the first quarter of the year as well as during the last months of the year.
Tip: the spot price for gold displayed in the charts is set around 10:30 and 15:00 GMT after different auctions made by the major players in the gold industry. Most of the traders open or close their position during this period. That is why it is recommended to trade gold within these time limits.
Conclusion:
The specific nature of gold asks for the special trading techniques to be used. You can use either the correlation strategy or the strategy of seasonal changes. But remember to take into account all of the factors, which can potentially influence gold. This will prevent you from risks and make your trading more profitable.

Bill Williams is the creator of some of the most popular market indicators: Awesome Oscillator, Fractals, Alligator, and Gator.

Trend strategies are good - they may give significantly good results in any time frame and with any assets. The main idea of the ADX Trend-Based strategy is to try to catch the beginning of the trend.

Counter-trend strategies are always the most dangerous but also the most profitable. We are pleased to present an excellent counter-trend strategy for working in any market and with any assets.

eurusd-is-falling-what-to-expect-from-the-future-price-movement

Greetings, fellow forex traders! Exciting news for those with an eye on the Australian market - the upcoming interest rate decision could be good news for Aussies looking to refinance or take out new loans. The Mortgage and Finance Association Australia CEO, Anja Pannek, has...

Hold onto your hats, folks! The Japanese yen took a nosedive after the Bank of Japan (BOJ) left its ultra-loose policy settings unchanged, including its closely watched yield curve control (YCC) policy. But wait, there's more! The BOJ also removed its forward guidance, which had previously pledged to keep interest rates at current or lower levels. So, what's the scoop? Market expectations had been subdued going into the meeting, but some were still hoping for tweaks to the forward guidance to prepare for an eventual exit from the bank's massive stimulus


Your request is accepted.
We will call you at the time interval that you chose
Next callback request for this phone number will be available in 00:30:00
If you have an urgent issue please contact us via
Live chat
Internal error. Please try again later