


Best Trade Ideas for April
I know we've had quite an amazing run these past few month, with over 78% accuracy in our trade ideas and sentiments, and thousands of pips in profits monthly...

Don’t waste your time – keep track of how NFP affects the US dollar!
Data Collection Notice
We maintain a record of your data to run this website. By clicking the button, you agree to our Privacy Policy.

Beginner Forex Book
Your ultimate guide through the world of trading.

Check Your Inbox!
In our email, you will find the Forex 101 book. Just tap the button to get it!
Risk warning: CFDs are complex instruments and come with a high risk of losing money rapidly due to leverage.
66.43% of retail investor accounts lose money when trading CFDs with this provider.
You should consider whether you understand how CFDs work and whether you can afford to take the high risk of losing your money.
Warning! Old version of the browser!
Press one of the icons below to proceed to the official website of the developer and download the latest version of your browser.

Online Forex broker
Information is not investment advice
On Monday, July 19th, gold traded lower as the rising numbers of coronavirus cases drove investors to move their savings into safe-haven assets such as the US dollar and Treasuries. This fact proves that gold is not being a safe-haven asset anymore. The price movement of the past few months suggests gold is being thought of as a risky investment despite the fact its holders do not get any interest or dividend.
At the beginning of the month, gold’s price was driven by concerns about inflation and Federal Reserves’ policy, but Monday’s early price action suggests this week’s movement will be driven by fears over risk.
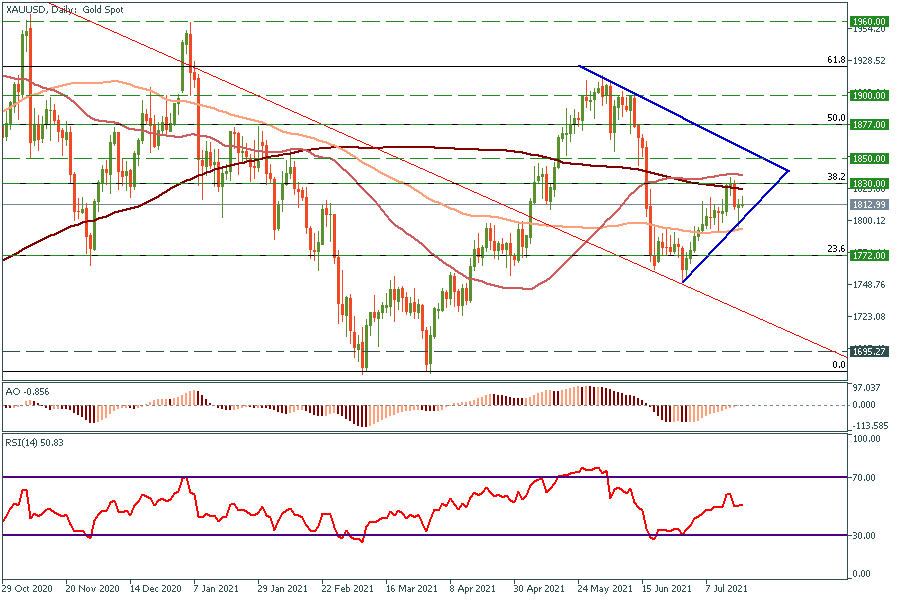
Daily chart
4H chart
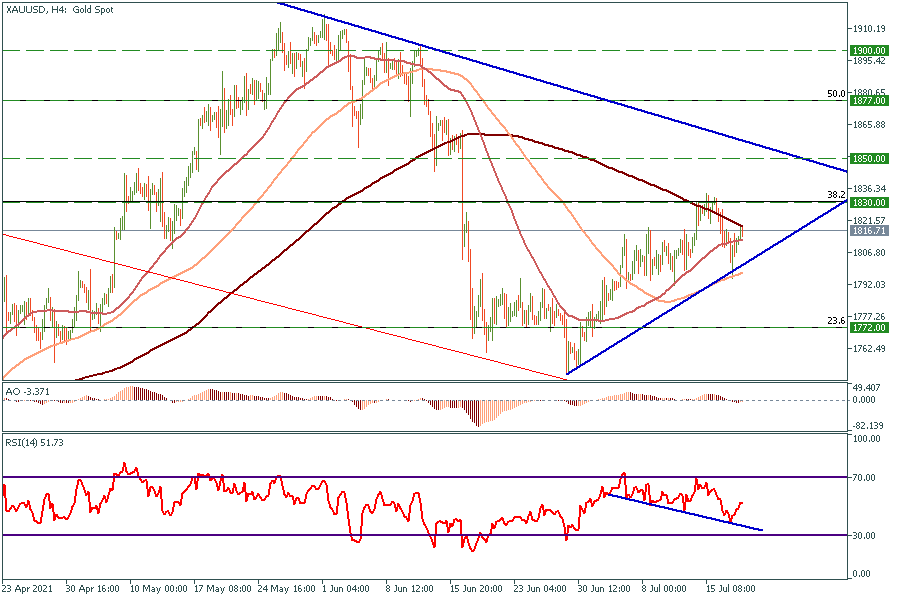
At the moment, the XAUUSD chart is forming a symmetrical triangle. The price is trading under the 200-period moving average between $1772 and $1830, which are 23.6 and 38.2 Fibonacci levels, respectively. On the RSI oscillator, the bullish hidden divergence has been formed, which means the rising trend is going to continue.
Short-term trades:
If the price breaks the 200-period moving average, it will head towards $1830 and $1850 price levels.
On the other hand, in case the price stays under the 200-period moving average it will drop to the bottom side of the triangle.
Long-term trades:
We suggest trading a break through the triangle lines. Breaking through the top line gives the target price of $1900, on the contrary, the price will be dropped at the $1772 price level.

I know we've had quite an amazing run these past few month, with over 78% accuracy in our trade ideas and sentiments, and thousands of pips in profits monthly...

Futures for Canada's main stock index rose on Monday, following positive global markets and gains in crude oil prices. First Citizens BancShares Inc's announcement of purchasing the loans and deposits of failed Silicon Valley Bank also boosted investor confidence in the global financial system...

Investor confidence in the global financial system has been shaken by the collapse of Silicon Valley Bank and Credit Suisse. As a result, many are turning to bearer assets, such as gold and bitcoin, to store value outside of the system without...

eurusd-is-falling-what-to-expect-from-the-future-price-movement

Greetings, fellow forex traders! Exciting news for those with an eye on the Australian market - the upcoming interest rate decision could be good news for Aussies looking to refinance or take out new loans. The Mortgage and Finance Association Australia CEO, Anja Pannek, has...

Hold onto your hats, folks! The Japanese yen took a nosedive after the Bank of Japan (BOJ) left its ultra-loose policy settings unchanged, including its closely watched yield curve control (YCC) policy. But wait, there's more! The BOJ also removed its forward guidance, which had previously pledged to keep interest rates at current or lower levels. So, what's the scoop? Market expectations had been subdued going into the meeting, but some were still hoping for tweaks to the forward guidance to prepare for an eventual exit from the bank's massive stimulus


Your request is accepted.
We will call you at the time interval that you chose
Next callback request for this phone number will be available in 00:30:00
If you have an urgent issue please contact us via
Live chat
Internal error. Please try again later